

Commercial buildings typically run separate systems for HVAC, lighting, security and power. Facilities teams keep temperature monitoring for compliance and power metering for cost, and the utility bill arrives once a month as a single figure.
The faults that raise consumption sit between those systems. A rooftop unit runs overnight in an unoccupied loading dock. A defrost heater cycles more often than its schedule requires. A compressor logs a rising number of starts per hour. None of it is represented until it reaches an invoice or causes a failure.
What facilities and energy teams need is the building represented in one place, in the units they already report in.
NEQTO.ai is a no-code operational intelligence platform. It collects data from the equipment already installed in the building, organizes it to match how the building is structured, and calculates the metrics facility and energy teams report on. No retrofit or custom development is required. The powerful built-in AI assistant organizes everything for you, just ask for what you want.
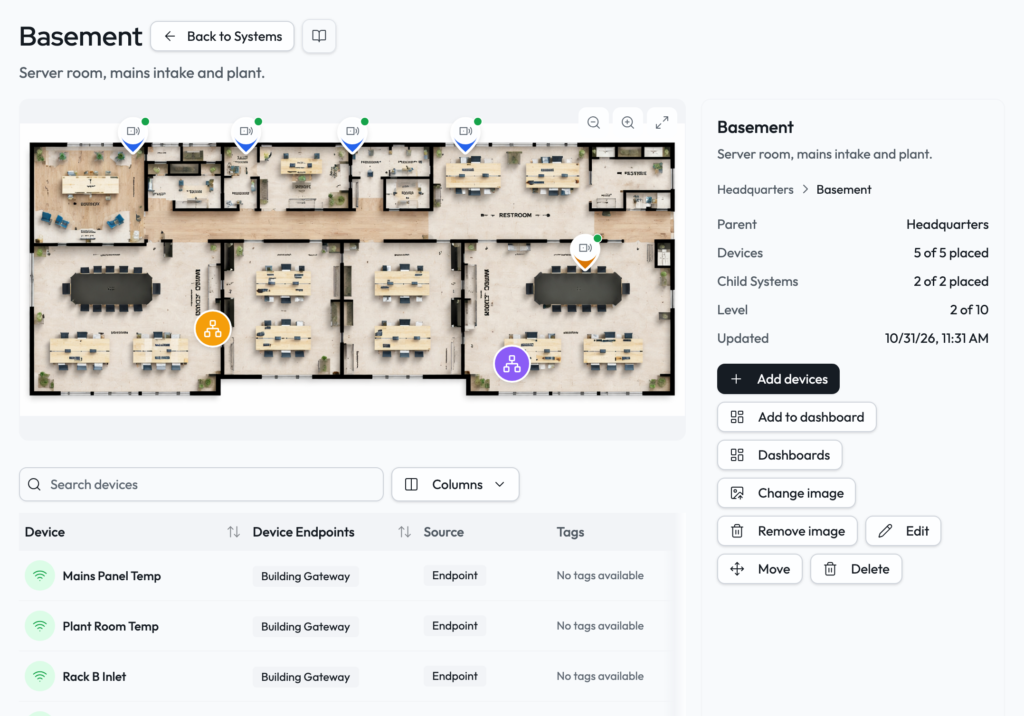
Equipment is grouped the way the building is organized: portfolio, site, floor, zone, and equipment, nested up to ten levels. A device can belong to more than one group, so a current clamp on a refrigeration circuit sits under both Loading Dock and Refrigeration without being duplicated. The same devices can be placed on a floor plan as pins. Each pin shows one live reading, changes color when an alert is active, and opens that device’s history when selected.
Ready-made templates turn readings from equipment already installed into the figures teams manage against: chiller efficiency, power factor, percent of setpoint, and similar measures. One chooses a template, points it at the equipment, and sees the result on live data before saving it. Plotting one reading against another, such as compressor current against zone temperature, is how short-cycling and rising run-time show up.
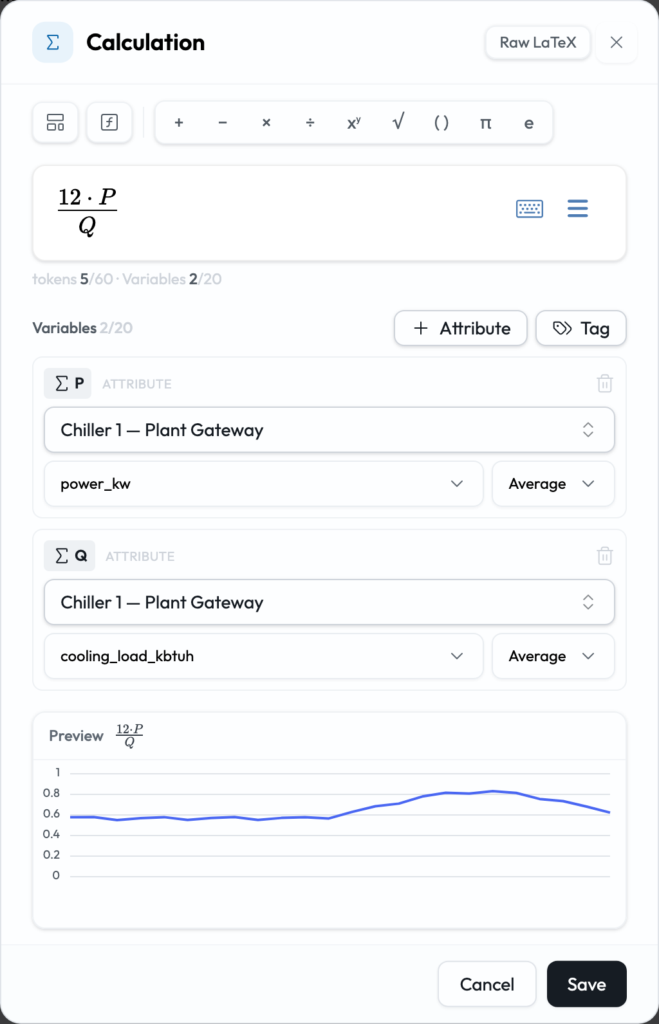
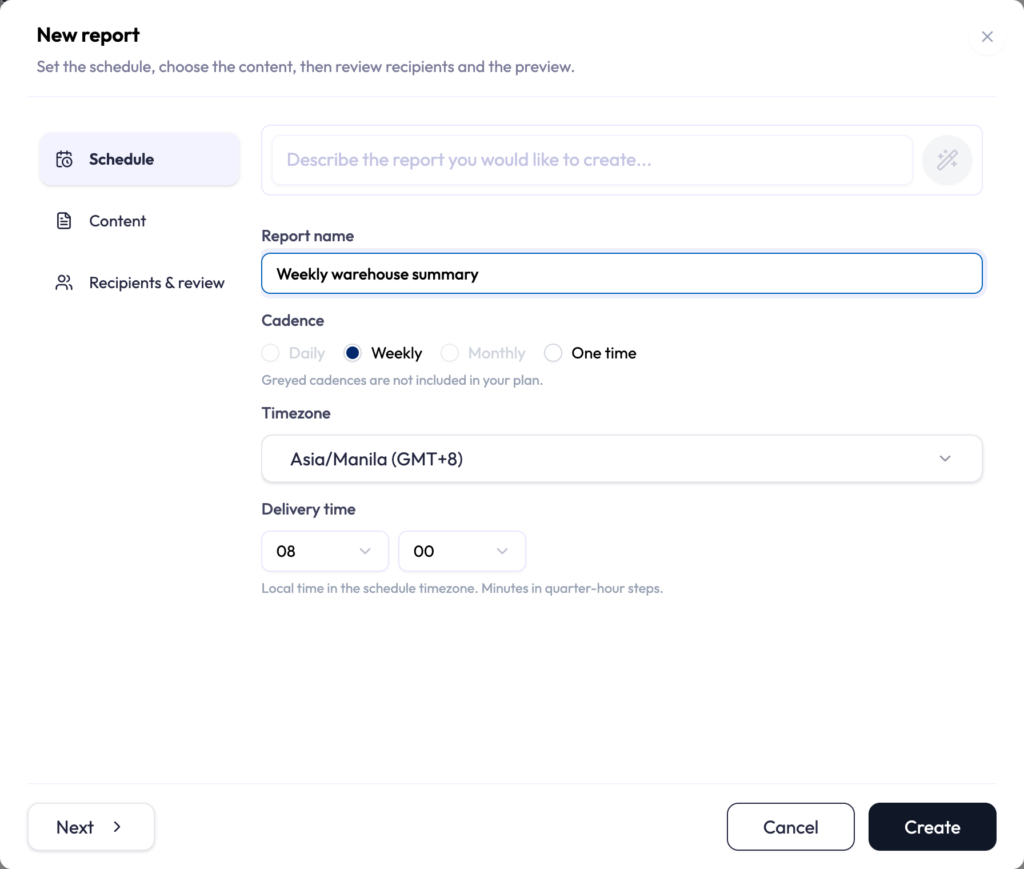
Facilities teams work in kilowatts and degrees, while corporate reporting asks for energy use intensity, carbon, and performance against a cap. NEQTO.ai calculates those figures continuously from the site’s own meters, so teams can see where a site stands during the year rather than after it. As an approved ENERGY STAR Web Services provider, NEQTO.ai pulls annual scores, energy, emissions, and water data for the properties. A weather connector brings local conditions into the same account; reused values such as a site’s emissions cap are stored in one place, and reports export to PDF.
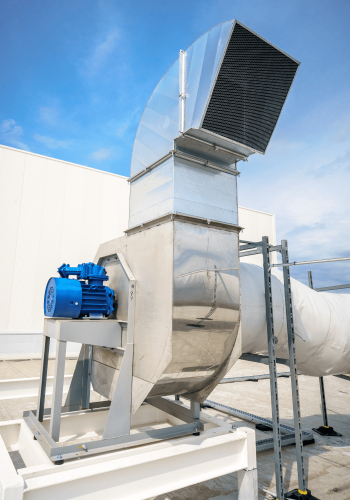
A mixed fleet of vans, trucks, and trailers spends most of its working life away from the people responsible for it. Location is confirmed by calling a driver. Condition is confirmed when the load is opened. Service is scheduled on a calendar rather than on how hard a vehicle has actually worked.
Problems that would be inexpensive to fix early are usually found late. A refrigeration unit drifts warm. A trailer sits at the wrong yard. A generator runs more hours than its service interval assumes. By the time anyone knows, the cost is a spoiled load, a missed delivery, or a roadside failure.

NEQTO.ai collects data from the devices on the vehicles, organizes it by depot and by asset, and shows location, condition, and running hours in one place. No telematics replacement or custom development is required.
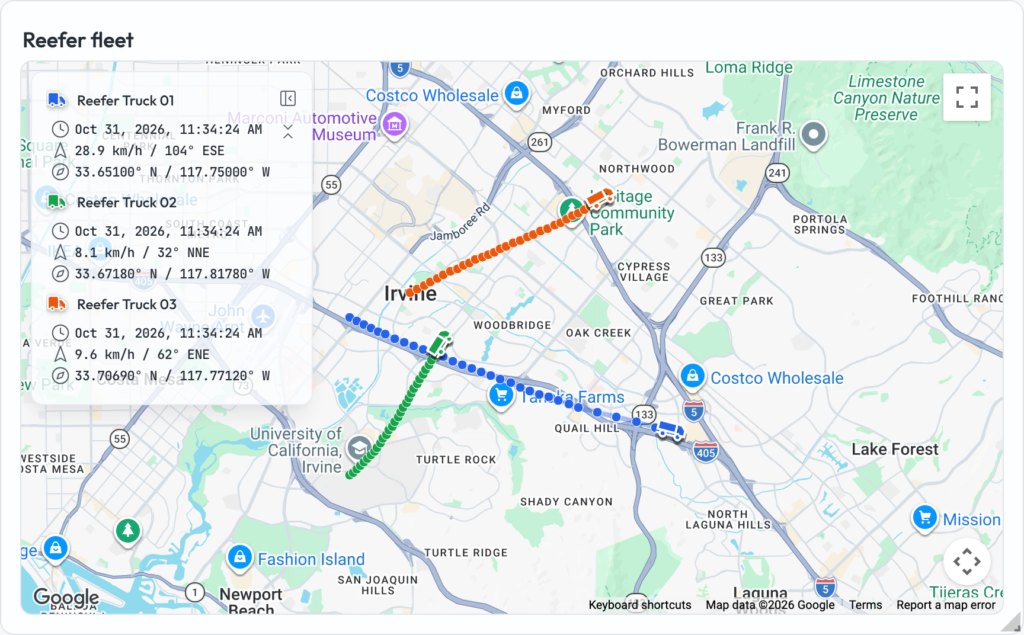
A tracking map plots any asset that reports its location on Google Maps, showing current position, speed and heading, and drawing the route it took to get there. The trail can be shown as a line, as points only, faded by time, or colored by speed. Selecting a point resolves it to a street address in the information panel. Up to eight assets can be followed on a single map.
The sensors on a vehicle report temperature, humidity, movement, impact, and door events as they happen, rather than when someone checks on arrival. A refrigeration unit drifting warm or a trailer opened at an unscheduled stop is visible while the vehicle is still on the road.
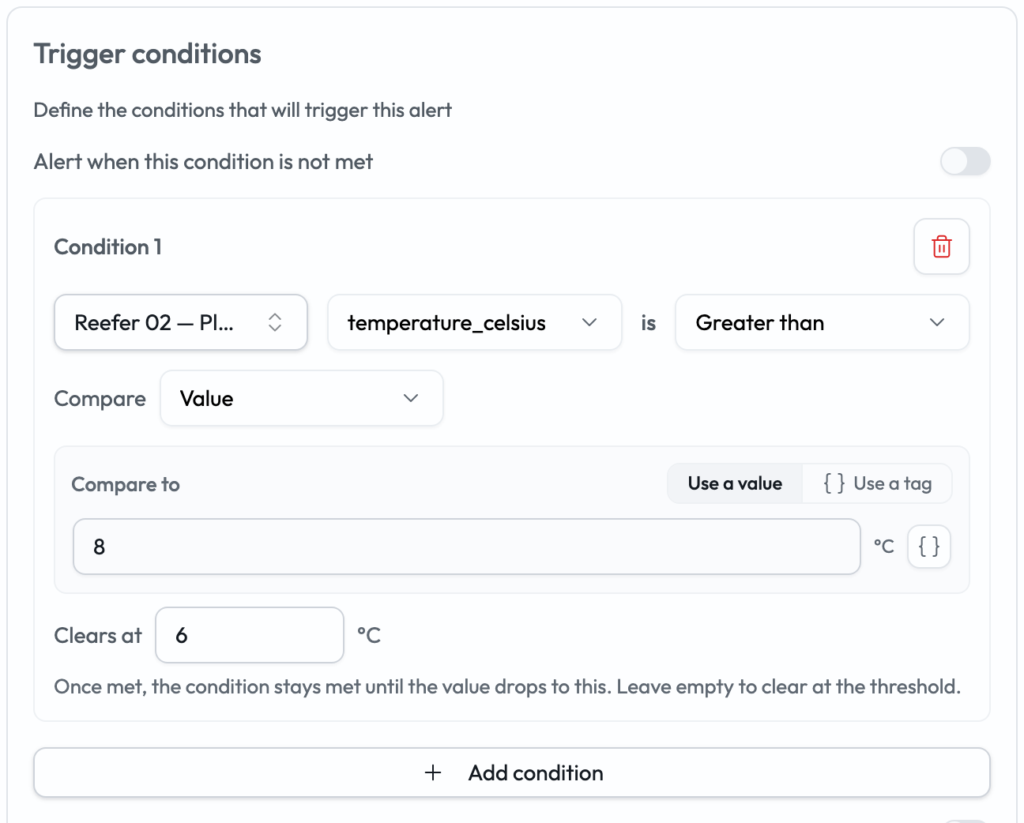
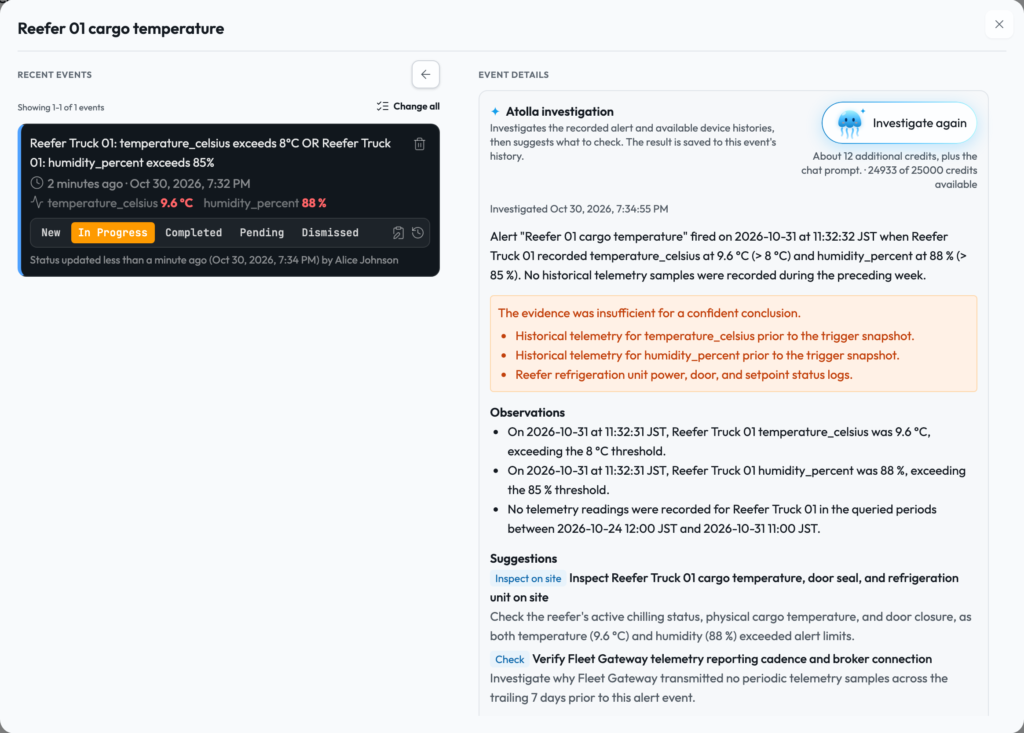
When an alert fires, NEQTO.ai can be asked to investigate it. It pulls readings from related assets and from the history of the asset involved, then returns what it found, the evidence behind it, and what to check. The summary is linked from the alert email, so a dispatcher can open it from their phone. Alerts are marked in progress, pending, dismissed, or completed, and everyone on that alert sees where it stands.
NEQTO.ai gives fleet and operations teams the location and condition of every asset while it is working, and a record they can refer to afterward

A lake and its tributaries are often monitored in person. Someone travels to each site, takes a sample or a meter reading, records it, and returns when schedules allow another trip.
Temperature, turbidity, and dissolved oxygen can shift substantially within hours of a storm, and the events worth recording tend to last hours or days rather than weeks. A migration window can open and close between two visits.
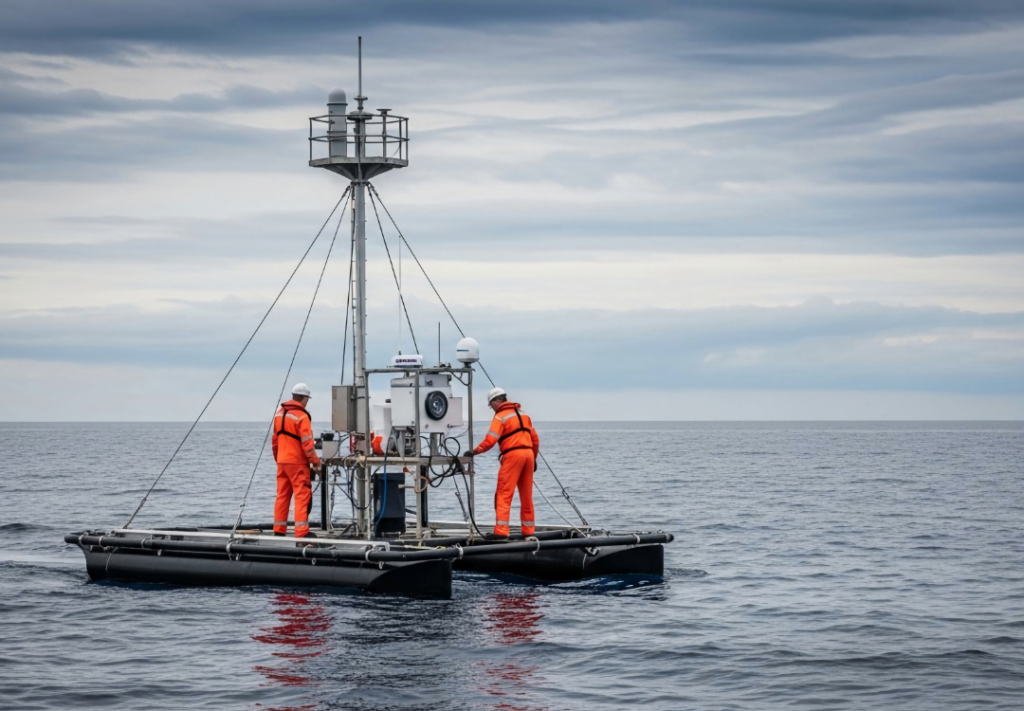
NEQTO.ai takes readings from the instruments at each site, arranges them the way the watershed is arranged, and keeps a continuous record that can be charted, compared, and set alerts on. Setting it up is a matter of describing what is needed, rather than working through a configuration project.
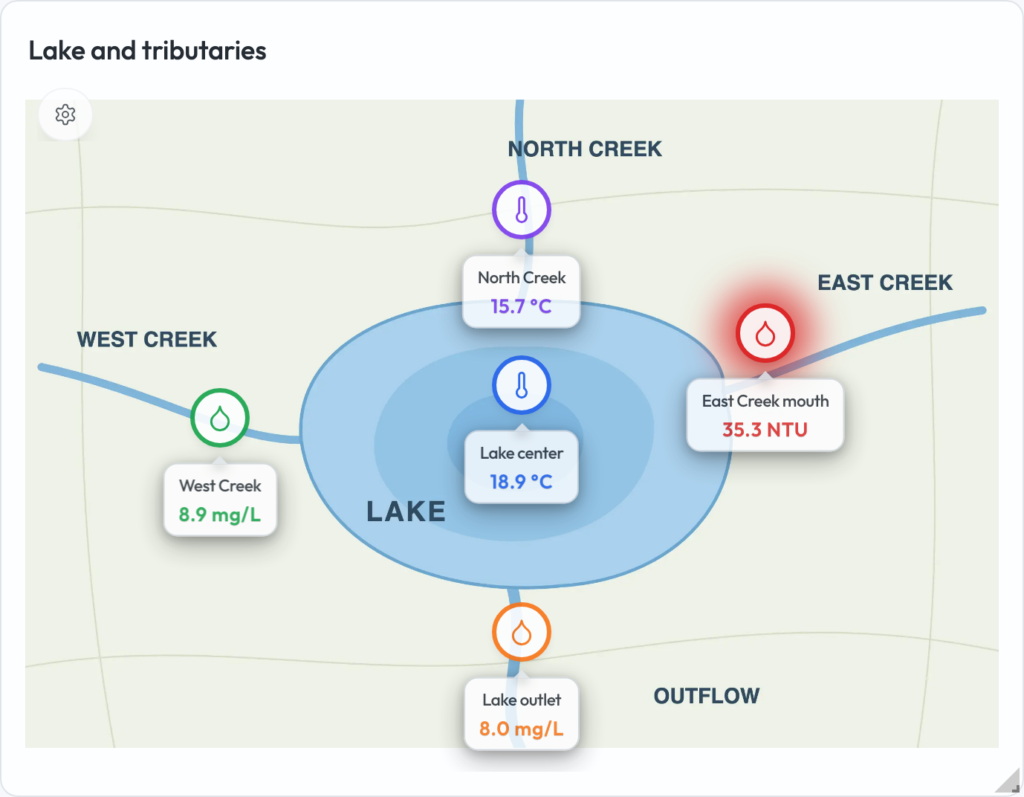
Stations are grouped the way the water runs: the lake, each tributary, and the monitoring points on it, nested as far as the structure needs. A station can sit in more than one group, so a stream mouth belongs to both its tributary and a separate group of sites a team is watching this season. Pins are placed on an image of the team’s choosing, such as a watershed map, a bathymetric chart, or a site diagram. Each pin shows a reading and changes color when an alert is active.
Temperature, pH, turbidity, dissolved oxygen, conductivity, and water level are stored as they arrive. A module at the station reads the probes wired into it and sends the readings over cellular or Wi-Fi. It can also read a chain of temperature sensors, which gives a depth profile through the water column. One measurement can be plotted against another, so turbidity against flow becomes a chart rather than an export. A weather integration brings local rainfall measurements into the same account, so a turbidity rise can be read against the rainfall that preceded it.
NEQTO.ai keeps a watershed recorded between visits, and puts the reading in front of the team while there is still time to act on it.