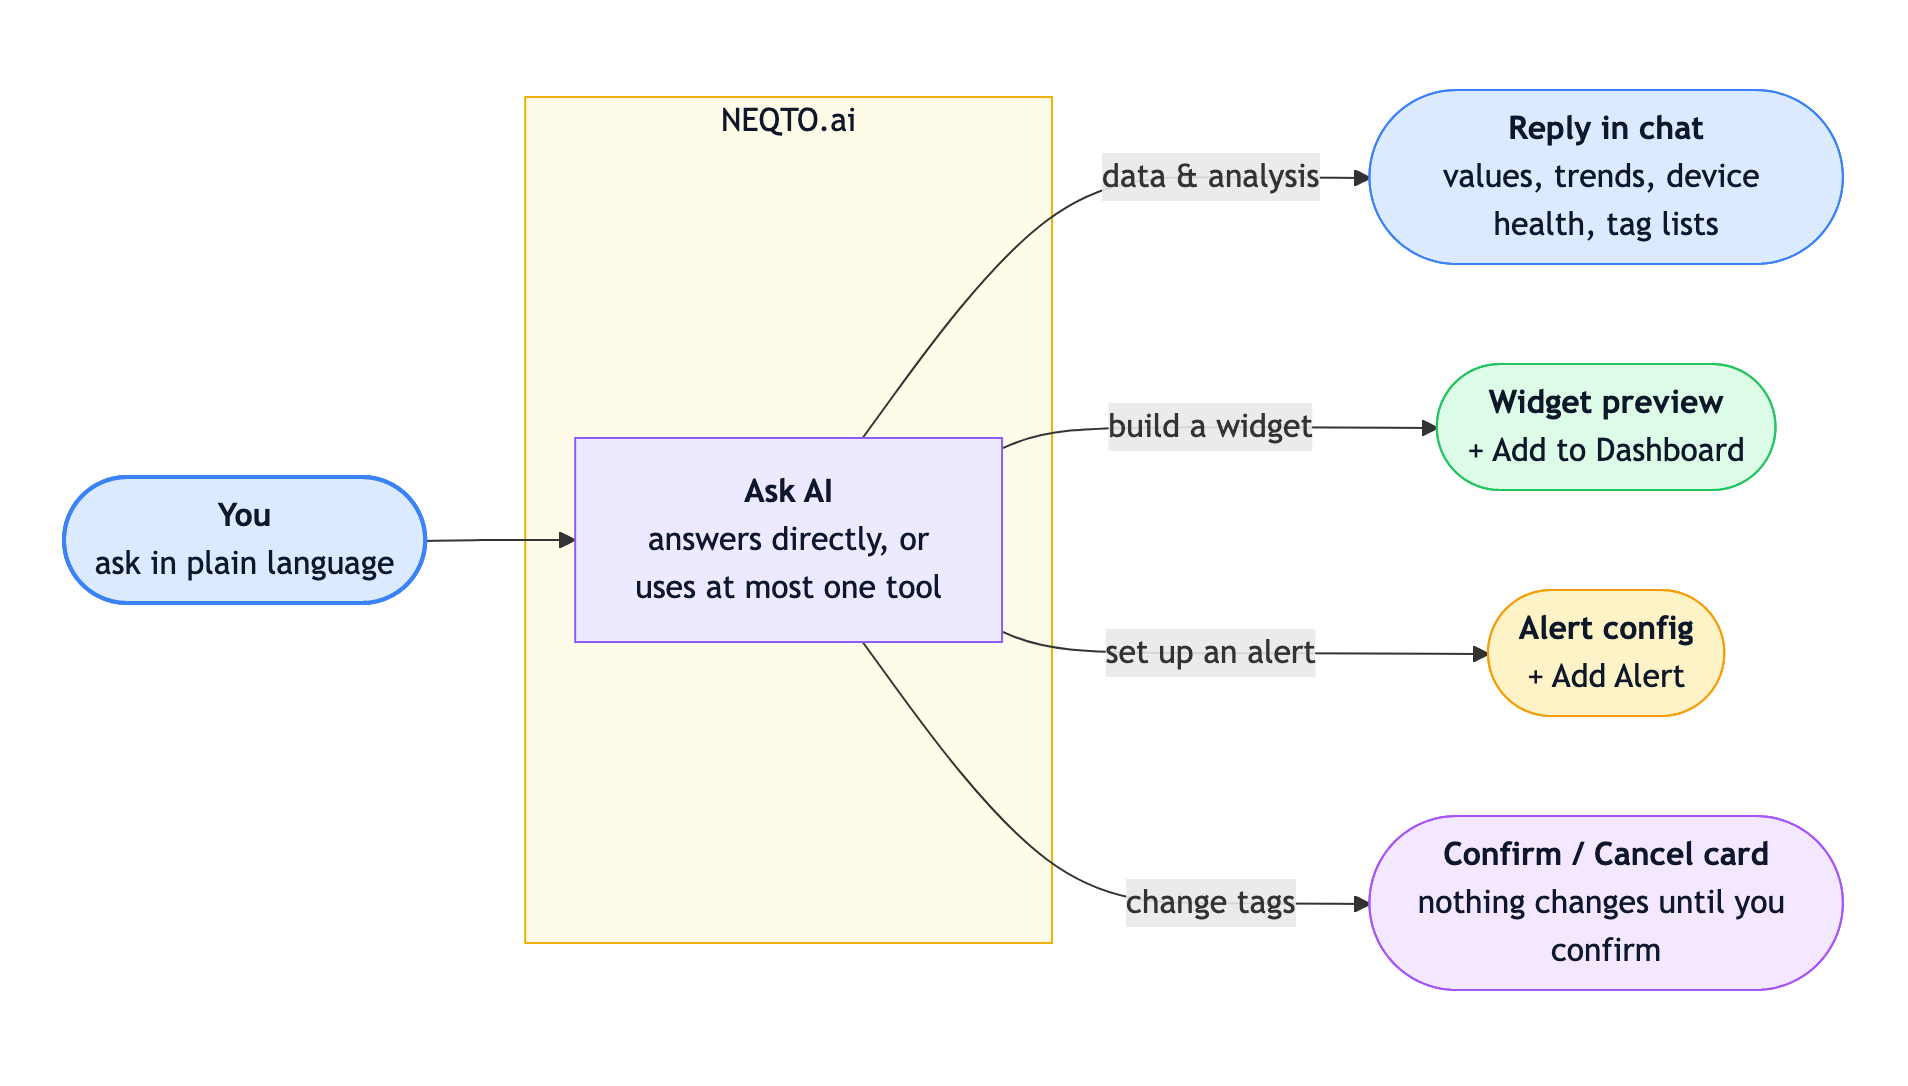
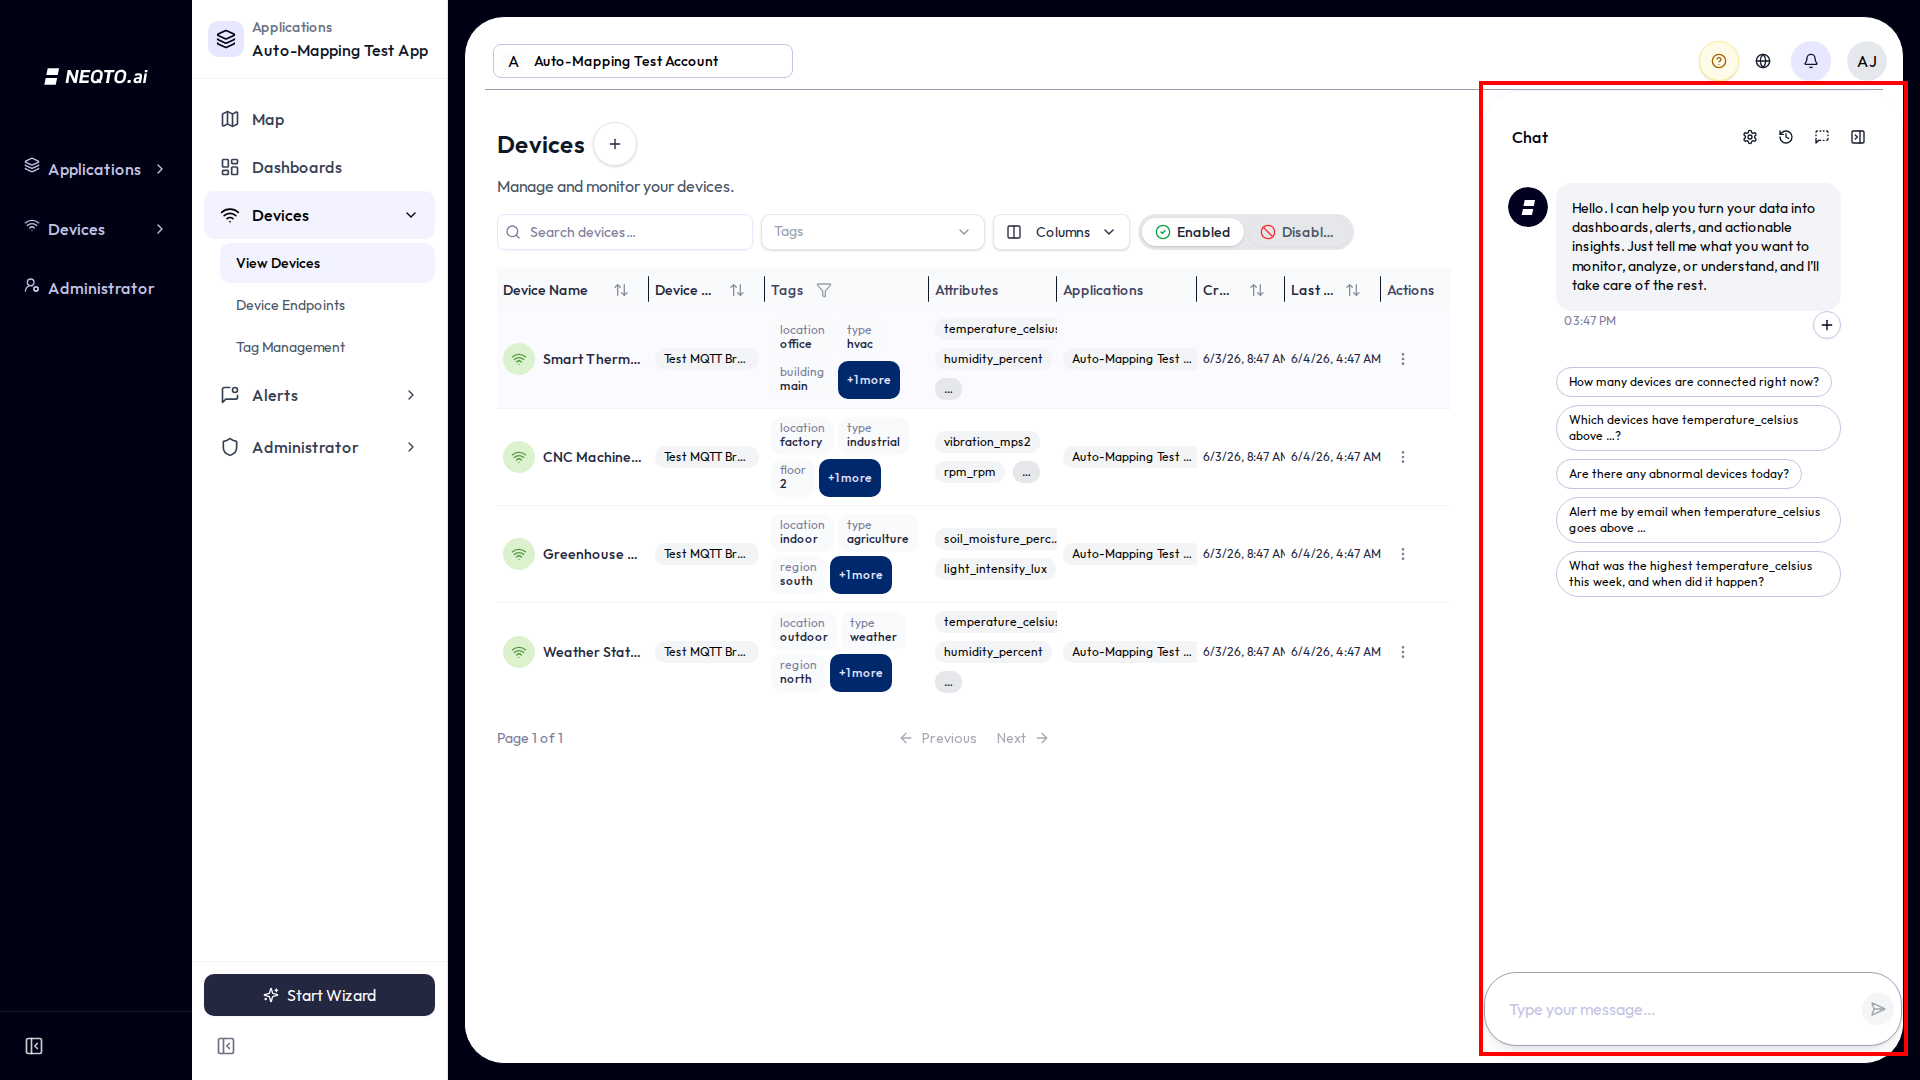
Ask AI is the conversational assistant built into NEQTO.ai. You describe what you want in plain language and the AI does it for you, usually without leaving the page you are on. It can answer questions about your device data, find peaks and exact moments, summarize trends, build a dashboard widget, and set up an alert. It reads what is on your screen, so “what does this chart show?” and “which devices on this floor are offline?” work as expected.
Quick Start
If you just want to start talking to it, here is the short version.
-
1Click the Ask AI button at the bottom-right of the screen to open the chat. On most pages it appears as a sidebar on the right edge.
-
2Optionally scope the chat to specific devices: click the small + button under the welcome message to open the device selector, then pick one or more. You can also just start typing; the AI can infer devices from your words and the page you are on.
-
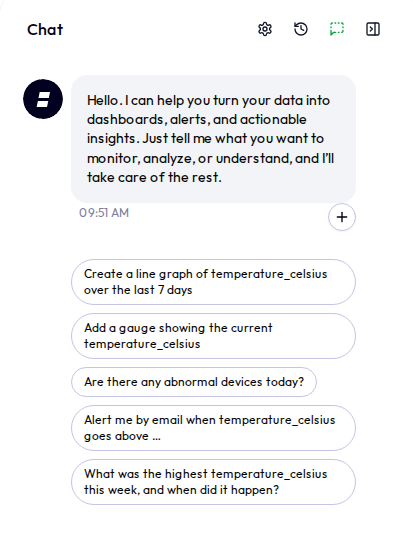
3Ask in plain language: “What was the highest temperature this week, and when did it happen?” A typing indicator shows while the AI works, then the full reply appears at once.
-
4When you ask it to build something, a preview and a button appear. Click Add to Dashboard or Add Alert, review the pre-filled form, and save.

What the AI Can Actually Do
This is the important part. Behind the scenes the AI does not free-wheel: it answers directly from what is on your screen, or — when a request needs one — uses a single tool from a fixed set of tools. Knowing them helps you phrase questions it can answer well. Plain-language capabilities below; the matching internal tool name is in parentheses.
| What you can ask for | The AI does this | Examples |
|---|---|---|
Look up a reading (request_data) |
Returns a current value, a value at an exact time, when a value or state occurred, or which devices match a value. | “What is the temperature?” · “What was the temperature at 3 PM?” · “When did temperature exceed 90?” · “When was the door open?” · “Which devices have humidity above 70?” |
Find a peak or low (find_extreme_value) |
Finds the exact maximum or minimum of one numeric sensor over a period, including the time and the device where it happened. | “What was the highest temperature this week, and when?” · “Lowest humidity yesterday.” |
Summarize or report (gain_insight) |
Aggregated analysis over time: averages, trends, sums, counts, and event/transition counts (for example connect/disconnect events). | “What’s the average temperature?” · “Temperature trend for the last 7 days.” · “How many disconnect events today?” |
Answer about your fleet (answer_question) |
Metadata, not sensor values: device counts and lists, which devices are connected or offline, what sensors a device has, and attribute info. | “How many devices do I have?” · “Which devices are offline?” · “What sensors does each device have?” |
Health check (detect_abnormal_devices) |
Scans alert events for problems, connectivity issues, anomalies, and malfunctions, then lists the abnormal devices with recommended actions. | “Are there any abnormal devices today?” · “Any connectivity issues?” · “Device health check.” |
Build a widget (create_widget) |
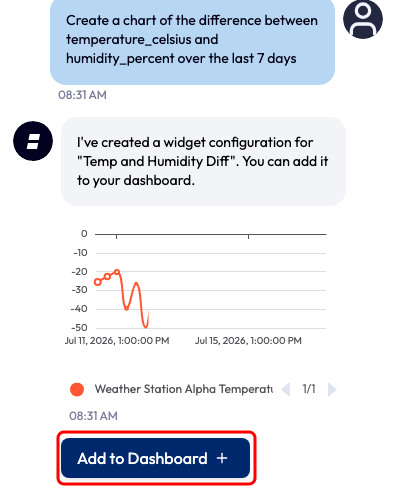
Drafts a dashboard widget (chart, gauge, label, table, and more) and shows a preview with an “Add to Dashboard” button. It can also draft calculated widgets — a value computed from your metrics (a difference, sum, or ratio across attributes or devices) — and multi-series charts, not just a single line. Main chatbot only. | “Create a line graph of CO2 over the last 7 days.” · “Add a gauge showing the current temperature.” · “Chart the difference between temperature and humidity over the last week.” |
Set up an alert (create_alert) |
Parses a monitoring rule into an alert config (threshold, comparison, severity, notifications, even multi-condition and lock-on-trigger) and opens it pre-filled for you to save. | “Alert me by email when temperature exceeds 75.” · “Notify me when a device disconnects.” |
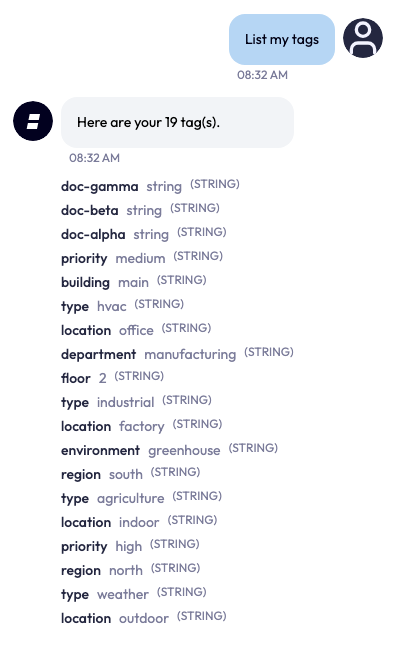
Look up tags (list_tags) |
Lists your tags (name, value, type) for the current scope. Read-only — it just shows them, with no confirmation needed. Main chatbot only. | “List my tags.” · “What tags do I have?” |
Create tags (create_tags) |
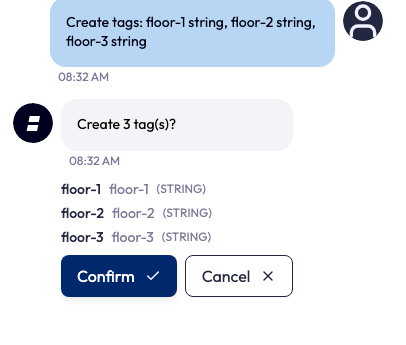
Proposes new tags from plain language or a pasted list (up to 50 at once) and shows a Confirm/Cancel card; nothing is saved until you confirm. Main chatbot only. | “Create tags floor-1, floor-2, floor-3.” · “Add these tags: <paste a list>.” |
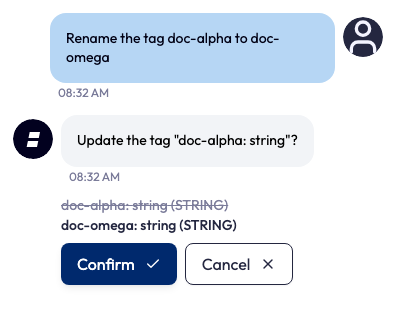
Rename or edit a tag (update_tag) |
Proposes a change to an existing tag’s name, value, or type and shows the before-and-after; applied only after you confirm. Main chatbot only. | “Rename tag floor-1 to floor-01.” · “Change the value of zone to B.” |
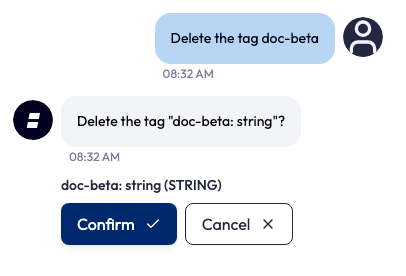
Delete a tag (delete_tag) |
Proposes deleting a tag; always confirmed first. Main chatbot only. | “Delete the tag floor-3.” |
Help me navigate (lookup_page_help) |
Explains where to do something and which page to go to. It already knows about the page you are on. | “Where do I add an endpoint?” · “How do I create a role?” |
Ask you to clarify (ask_user_clarification) |
As a last resort, asks one short follow-up with quick-pick options when your request is genuinely ambiguous. | “Which sensor — temperature or humidity?” |
Answers from what is on your screen
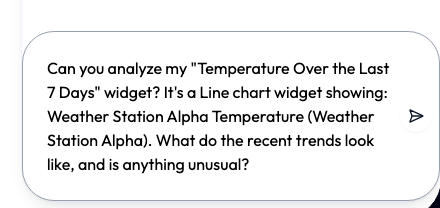
The chat knows which page you are viewing and a small, safe slice of what it shows. So when you ask “what does this chart show?”, “describe the gauge”, or “how many devices are connected on this floor?”, the AI answers directly from the page instead of re-running a query. It only runs a data tool when you want a genuinely new calculation, a live value the page does not already show, or to create or change something.
- The AI never saves a widget or alert on its own. It drafts the config and you confirm it in the normal editor.
- The alert config it produces is a best-effort first draft. Always check the threshold, direction, period, and notifications before saving.
- It works on your data only, scoped to the current application when you are inside one.
How to Phrase a Good Request
A small naming detail makes the AI much more accurate. The UI and the AI use slightly different words for the same things.
| You see in the UI | The AI’s tools call it |
|---|---|
| Endpoint | data source |
| Attribute | data type |
You do not need to learn the internal names. The point is the opposite: use the names you actually see in the app. Refer to your sensors by the attribute label shown on the device (for example “temperature” or “humidity”) and to devices by their device name. The AI matches against your real attribute and device names, so the closer your wording is to what is on screen, the better.
- Name the metric the way the app does. If your attribute is
temperature_celsius, “temperature” or “temp” still works, but exotic phrasing may not. - Say a time period if you have one. “today”, “yesterday”, “last 7 days”, “this week”, “last month”, “last 3 hours” are all understood and turned into exact dates. Leave it out and the AI picks a sensible default.
- Pick devices first when it matters. Selecting devices (or being on a device’s page) tells the AI exactly what “this device” means.
- For widgets, be visual. “line graph”, “bar chart”, “gauge”, “table”, a value range like “y-axis 0 to 100”, and a time window like “last 7 days” are all recognized.
- For alerts, state the rule. Metric + condition + value, plus how you want to be notified: “Alert me by email when humidity exceeds 75.”
Devices (Main Chatbot)
The main chatbot lets you scope a question to specific devices. It is optional.
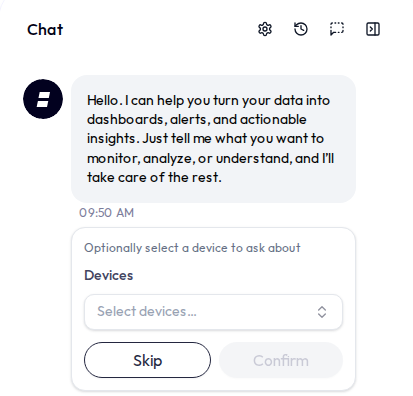
- Devices — click the small + under the first message and choose one or more. After that, “this device” and unqualified questions point at your selection.
- Time period — there is no separate date picker; just say the period in your message (“today”, “last 7 days”, “this week”). Leave it out and the AI picks a sensible default.
Turning a Reply Into a Widget or Alert
When you ask the AI to build something, it does not just describe it. It hands you a ready-to-save draft.
Add to Dashboard (main chatbot)
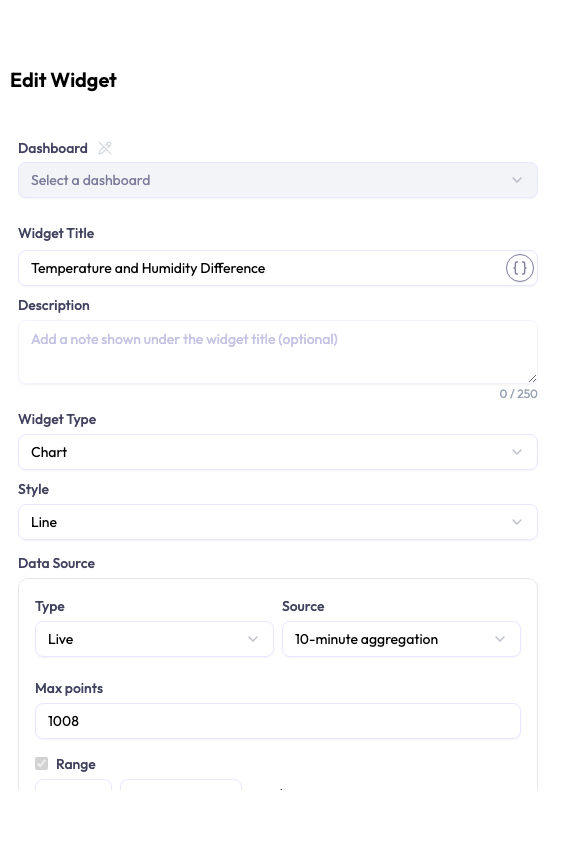
Ask for a chart or gauge and the bot reply includes an inline preview of the widget plus an Add to Dashboard button. Click it to open the normal Widget Editor pre-filled with the AI’s configuration. Choose a dashboard and save. After saving, the chat confirms it and the button will not show again for that message.
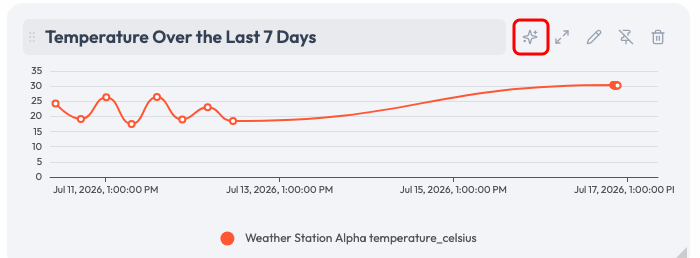
This is not limited to a single line. Ask for a calculated widget — a value derived from your metrics, such as the difference, sum, or ratio between two attributes — or a multi-series chart, and the AI drafts that too. The preview below, for example, plots the difference between two attributes as one computed series.
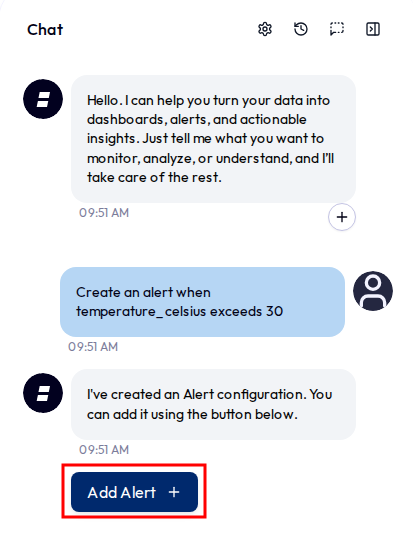
Add Alert (both chatbots)
Describe a condition to monitor and the bot reply includes an Add Alert button with a parsed configuration: the metric, threshold, direction, and notifications. Click it to open the Alert dialog pre-filled, review, and save. The same one-time button behavior applies once saved.
Managing Tags
A tag is a label you attach to devices to group and filter them — a name plus a typed value, such as floor = 1. In the main chatbot you can manage tags just by asking: list them, create them, rename or edit them, and delete them, all in plain language. (Tag management by chat is main-chatbot only; the Smart Building chat does not do it.)
It proposes, you confirm
The AI never changes a tag on its own. When you ask it to create, rename, or delete tags, it replies with an inline Confirm / Cancel card showing exactly what it will do. Nothing is saved until you click Confirm — click Cancel and nothing happens. This is the same “it will not act behind your back” promise used for widgets and alerts.
Create several at once
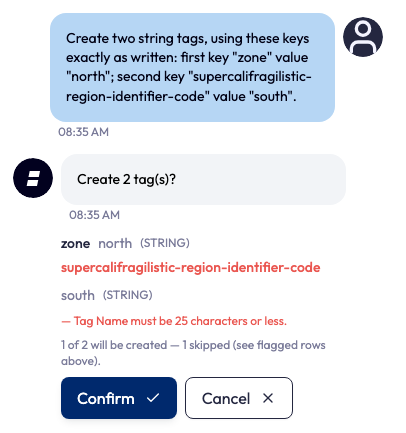
You can create tags in bulk — paste a list or a comma-separated set and the AI proposes up to 50 tags in one message, each parsed into a name, value, and type. Before you confirm, it validates every row: a row that breaks a rule (for example a name longer than 25 characters) is flagged in red and left out, and a note tells you how many will be created and how many were skipped. If your list is longer than 50, it asks you to send the rest in another message.
Rename, edit, or delete
Ask to rename or change a tag and the card shows the change as a before-and-after (the old value struck through, the new value beside it). Ask to delete one and it shows the tag it will remove. Both wait for your Confirm.
Just looking
Asking to list your tags is read-only: the AI simply shows them (name, value, and type) and there is no Confirm button, because nothing is changing.
Settings, History, and Sessions
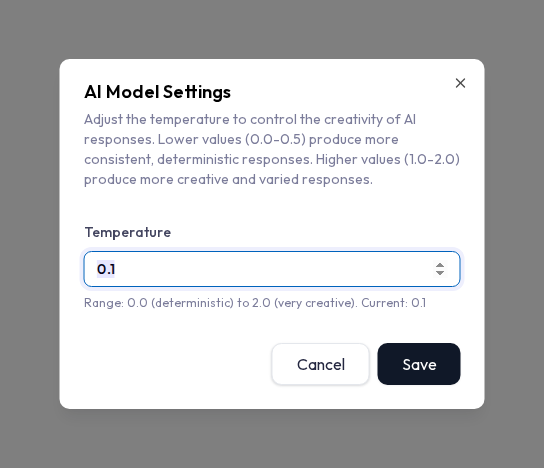
Temperature (creativity)
The settings icon opens the AI Model Settings dialog, which holds a single Temperature field. Temperature controls how creative the AI’s wording is, from 0.0 (focused and consistent) to 2.0 (more varied). The default is 0.1. The setting is remembered in your browser and is shared by both chatbots.
Chat history
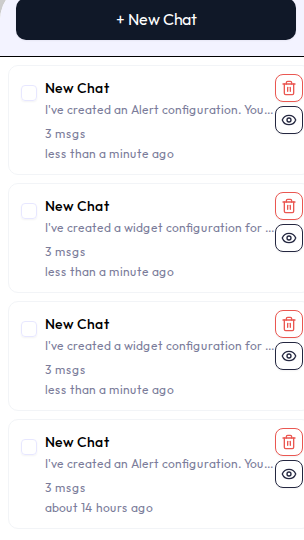
Every conversation is saved automatically. The history icon slides in a list of your past sessions, newest first, each showing its title, message count, and how long ago it was. Click one to reopen it and keep going. A session is created the moment you send your first message, so a chat you open but never use leaves nothing behind.
- New chat starts fresh. Your previous session stays in history.
- Delete a session per row, or tick several and delete them together. Deletion is confirmed and is not undoable.
- Each surface only lists its own sessions.
Connection
The chat runs over a live connection to the server. A typing indicator shows while the AI works; then the full reply appears in the chat at once.
- It needs a connection. The chat keeps a live link to the server. If it cannot reach it, you will see “Failed to send message. Please check your connection and try again.” It retries and reconnects on its own with a short backoff.
- Reloading while it is working. If you refresh while the AI is still working on a reply, that response may not arrive or be saved. On reload you will see your question but possibly not the answer. Just ask again.
- The panel resets on navigation, history does not. Moving between pages can clear the on-screen messages, but your saved session is always one click away in history.
Limits and Good to Know
A few things that are not obvious from the screens.
| Limit | What it means |
|---|---|
| AI usage | AI usage is metered in tokens against an allowance set by your plan. Usage is counted in 30-day periods based on your plan’s start date. After the allowance is exhausted, new Ask AI requests are rejected until the current period resets or the plan changes. The exact token allowance depends on your plan. |
| Demo limit | In the public demo experience, a session may be capped at a fixed number of questions. The error message reports the applicable limit when it is reached. This cap applies to the demo only, not to a normal signed-in account. |
| Permissions | You need chatbot access (the CHATBOT_USE permission) to see either surface at all. The Add to Dashboard button needs widget-create permission — without it the reply still arrives, just without that button. The Add Alert button always shows; the alert-create permission is checked when you actually save, and you’ll be told if you cannot create alerts here. Tag changes need the matching tag permission for the tag’s scope (account or application), checked when you confirm — without it the card shows a note in place of the Confirm button. |
| Scope | When you are inside an application, questions are scoped to that application’s devices. |
- At most one tool per turn. A message either gets a direct answer or triggers a single tool action. To do two things, ask in two messages (first get the insight, then ask for the widget).
- It will not act behind your back. Widgets, alerts, and tag changes always go through a step you confirm.
- Use on-screen names. The closer your wording is to your real attribute and device names, the more reliable the answer.
- Lean on page awareness. Asking “what does this show?” about the current page is faster than re-describing a query.
- History is your friend. Multi-step work (analyze, then build) is easy to resume from a saved session.