The built-in simulator lets you work with NEQTO.ai before connecting any physical hardware. Use it to prototype dashboards, validate JSON payload formats, and test automation such as alerts and anomaly detection — all from a demo device endpoint.
Quick Start
If you are familiar with NEQTO.ai, here is the short version:
-
1
Create a demo device endpoint from within any application (Devices → Device Endpoints → Add device endpoint → Create Demo Device Endpoint).
-
2
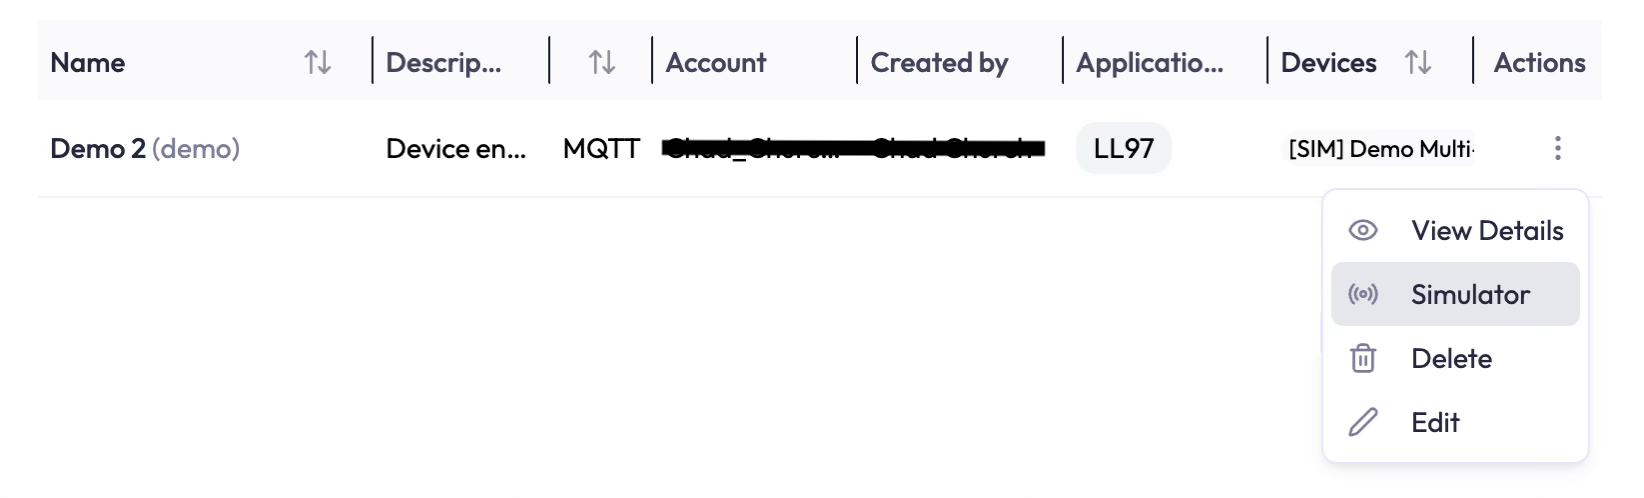
Open the endpoint’s Actions menu (the three dots) and choose Simulator.
-
3
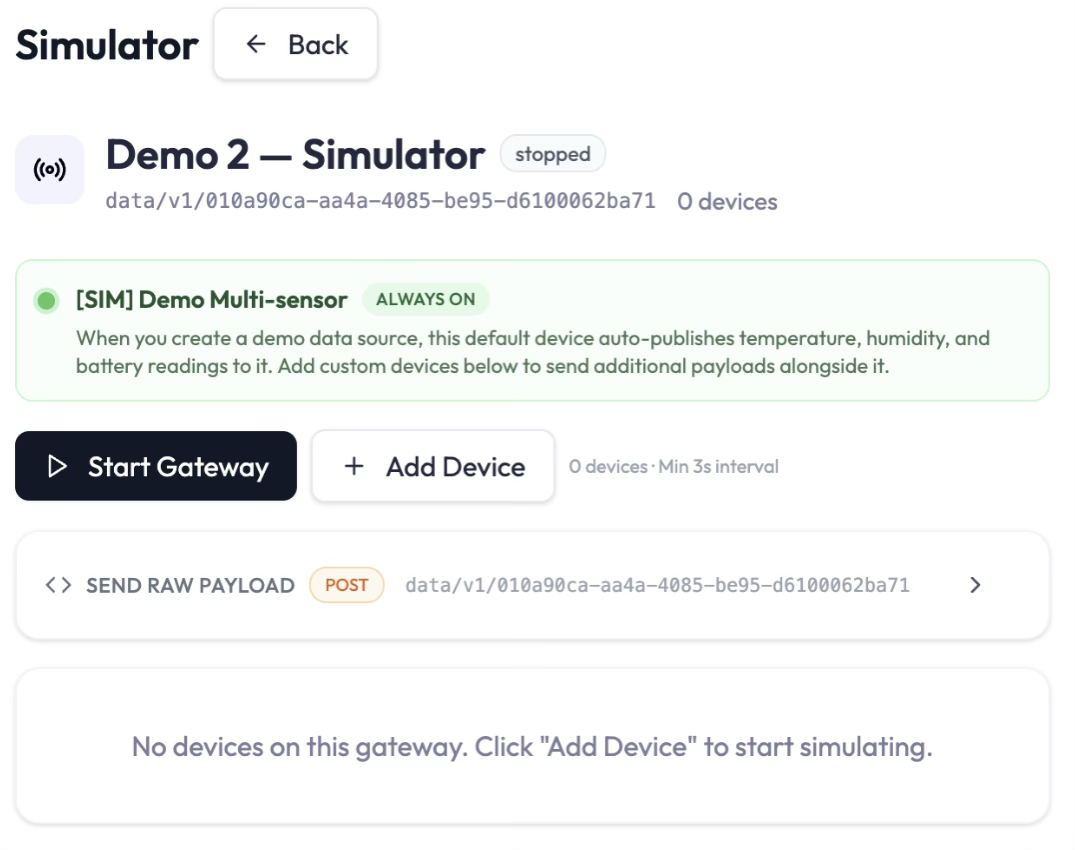
Click Start Gateway. The always-on Demo Multi-sensor begins sending data immediately.
-
4
Click Add Device to add a sensor from the catalog, set its interval, and customize its value ranges.
-
5
Use Send Now to push specific values (handy for triggering alerts), or Send Raw Payload to test a custom JSON payload.
Detailed Instructions
Step 1 — Create a demo device endpoint
-
1
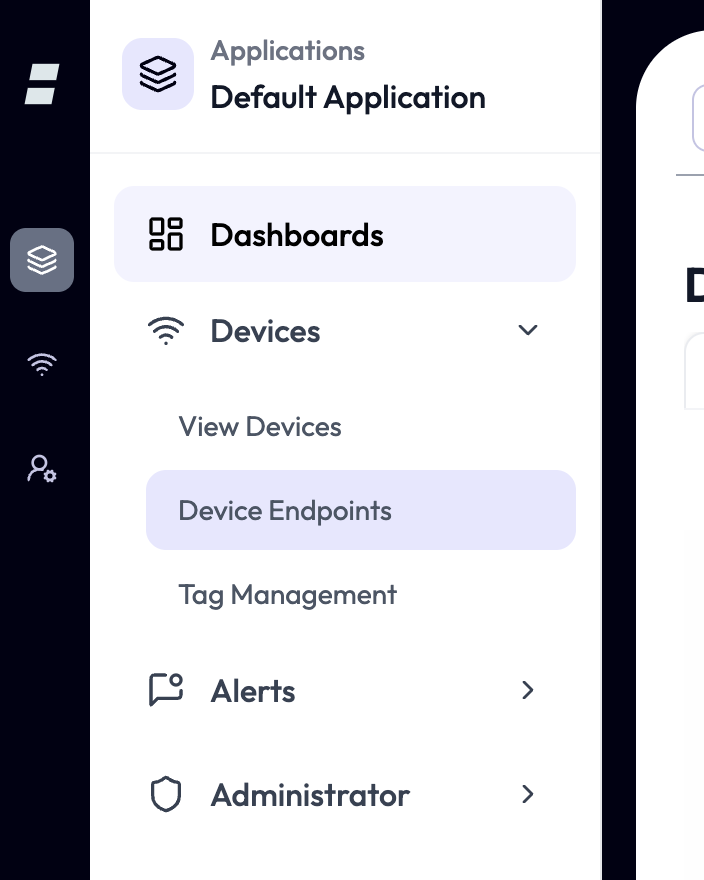
In your NEQTO.ai account, open any application and go to Devices → Device Endpoints.
-
2
Click Add device endpoint, then Create Demo Device Endpoint. Give it a name, click Next, then Finish. You will not need the connection details for this endpoint.
Step 2 — Open the Simulator
-
1
In the Actions column for your demo endpoint, click the three dots and select Simulator.
Step 3 — Start the gateway
-
1
Click Start Gateway to begin publishing. This also starts any device currently on the gateway. Once running, each device can be paused, stopped, and started independently of the gateway.
Step 4 — Add a device
-
1
Click Add Device to open Add Device From Catalog.
-
2
Open the Select a device template dropdown and choose a device type to simulate (for example, Barometric Sensor).
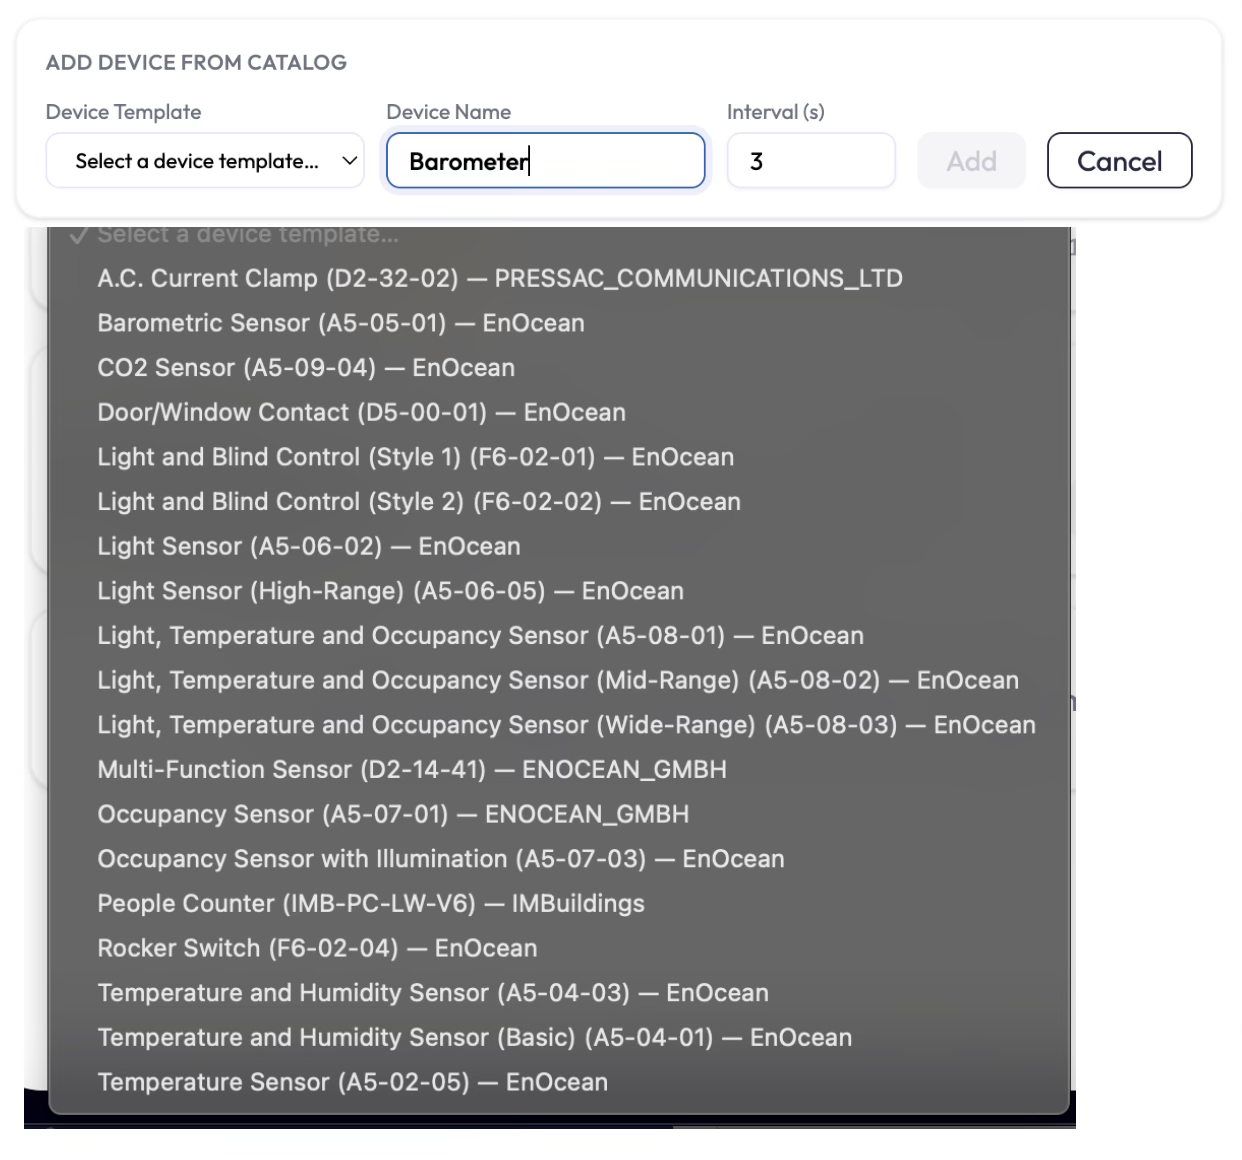
-
3
Enter a Device Name and set the Interval (in seconds) for automatic sends.
-
4
Click Add. The new device appears on the gateway in stopped status.
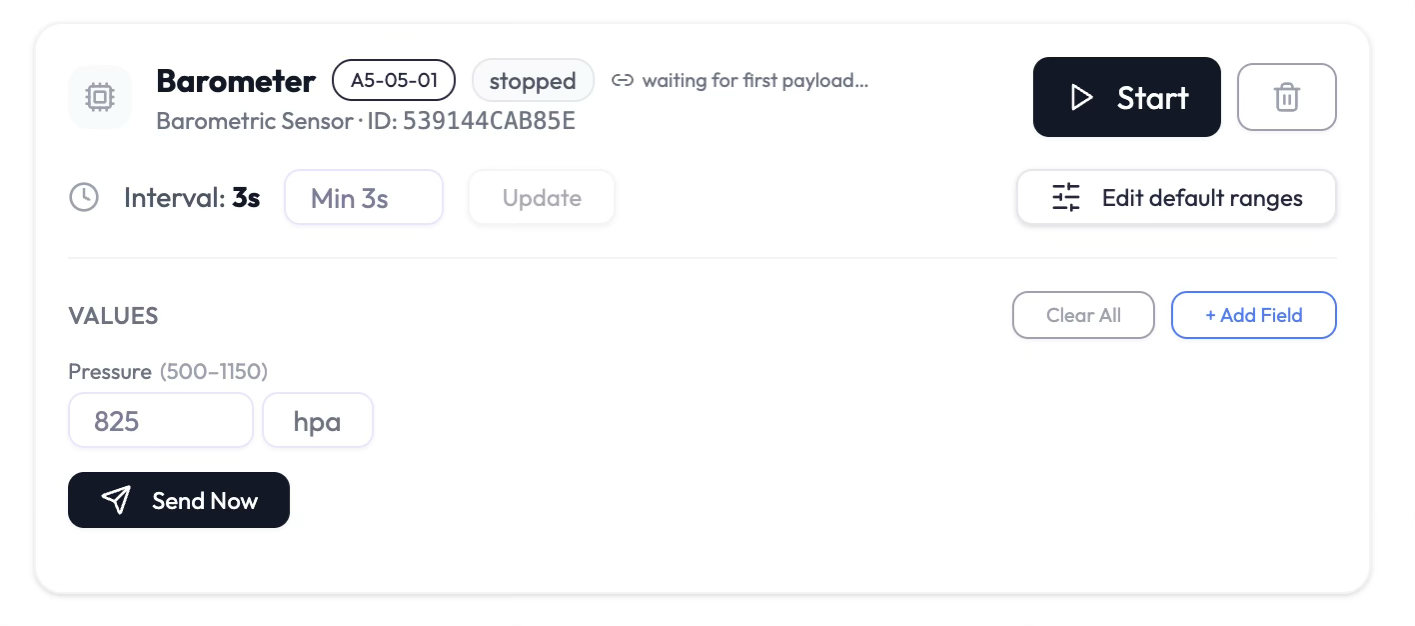
Each device panel gives you these controls:
- Start / Pause / Stop — when the gateway is running, the Start button is replaced by Pause and Stop so the device can run independently.
- Interval — change the send interval in the text box and click Update.
- Edit default ranges — define the range and behavior of generated values (see Step 5).
- Values — text boxes for every field the device sends, used with Send Now to push specific values (see Step 7).
- Add Field — add a custom field to the payload (see Step 6).
After Step 4, you can start creating widgets in a dashboard and asking the AI chatbot about your demo device. Continue to Step 5 to learn more about customizing your simulation.
Step 5 — Edit default ranges (Optional)
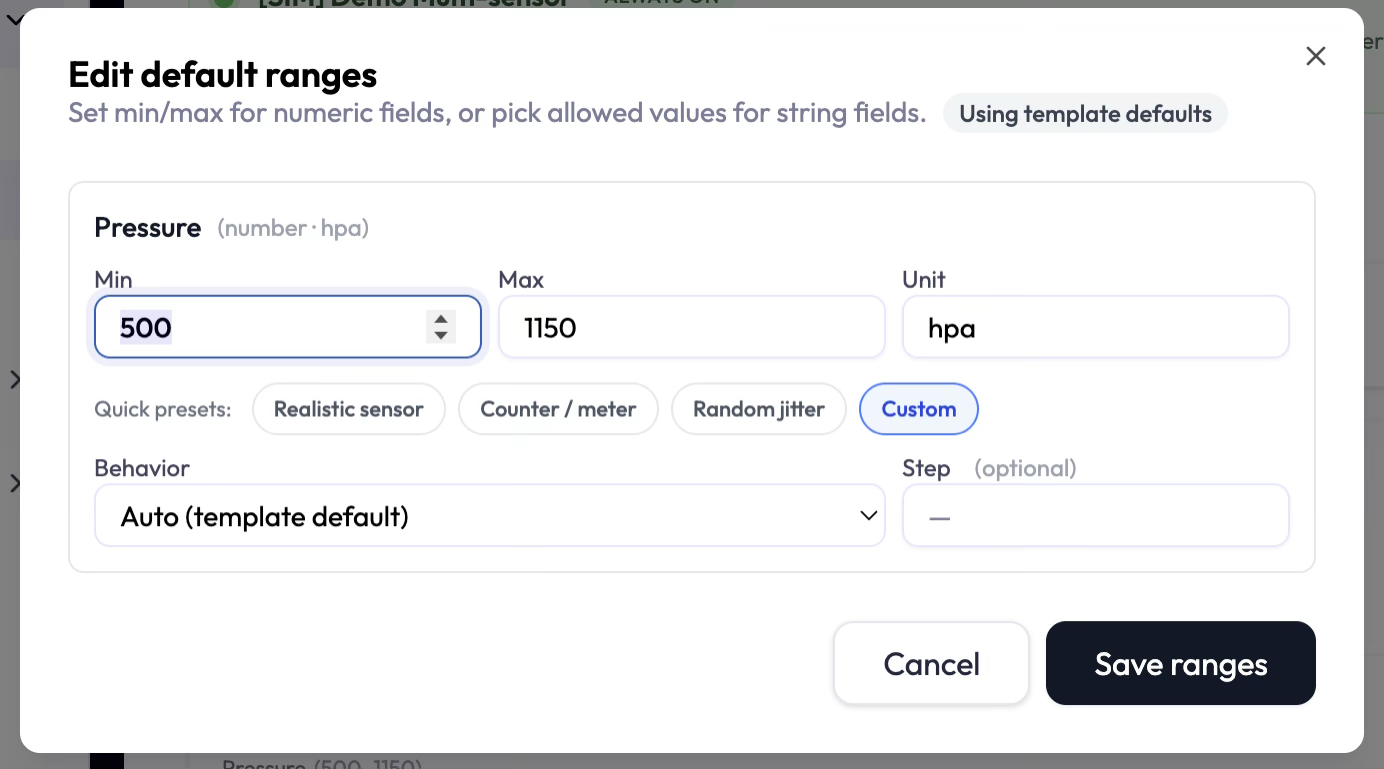
Click Edit default ranges to control how each numeric field generates its automatic values.
- Min and Max — the bounds of the generated values. The unit is fixed by the template and cannot be changed.
- Quick presets — a behavior model for the field. Each can be tuned with a step value:
- Realistic sensor — values wobble around the midpoint of the min/max range.
- Counter / meter — values count up by the step value and reset when the max is reached.
- Random jitter — random values with no meaningful pattern.
- Save ranges — stores your settings and returns to the simulator. When a field uses non-default settings, an Override active badge appears on the device.
Step 6 — Add a custom field (Optional)
Use Add Field to send an attribute that is not part of the device template — useful for testing how your application handles extra payload data.
-
1
Click Add Field. A dialog prompts for the field name.
-
2
Enter a name and click OK. The dialog closes and the new field appears in the Values section with its own value and unit boxes.
Step 7 — Send specific values with Send Now (Optional)
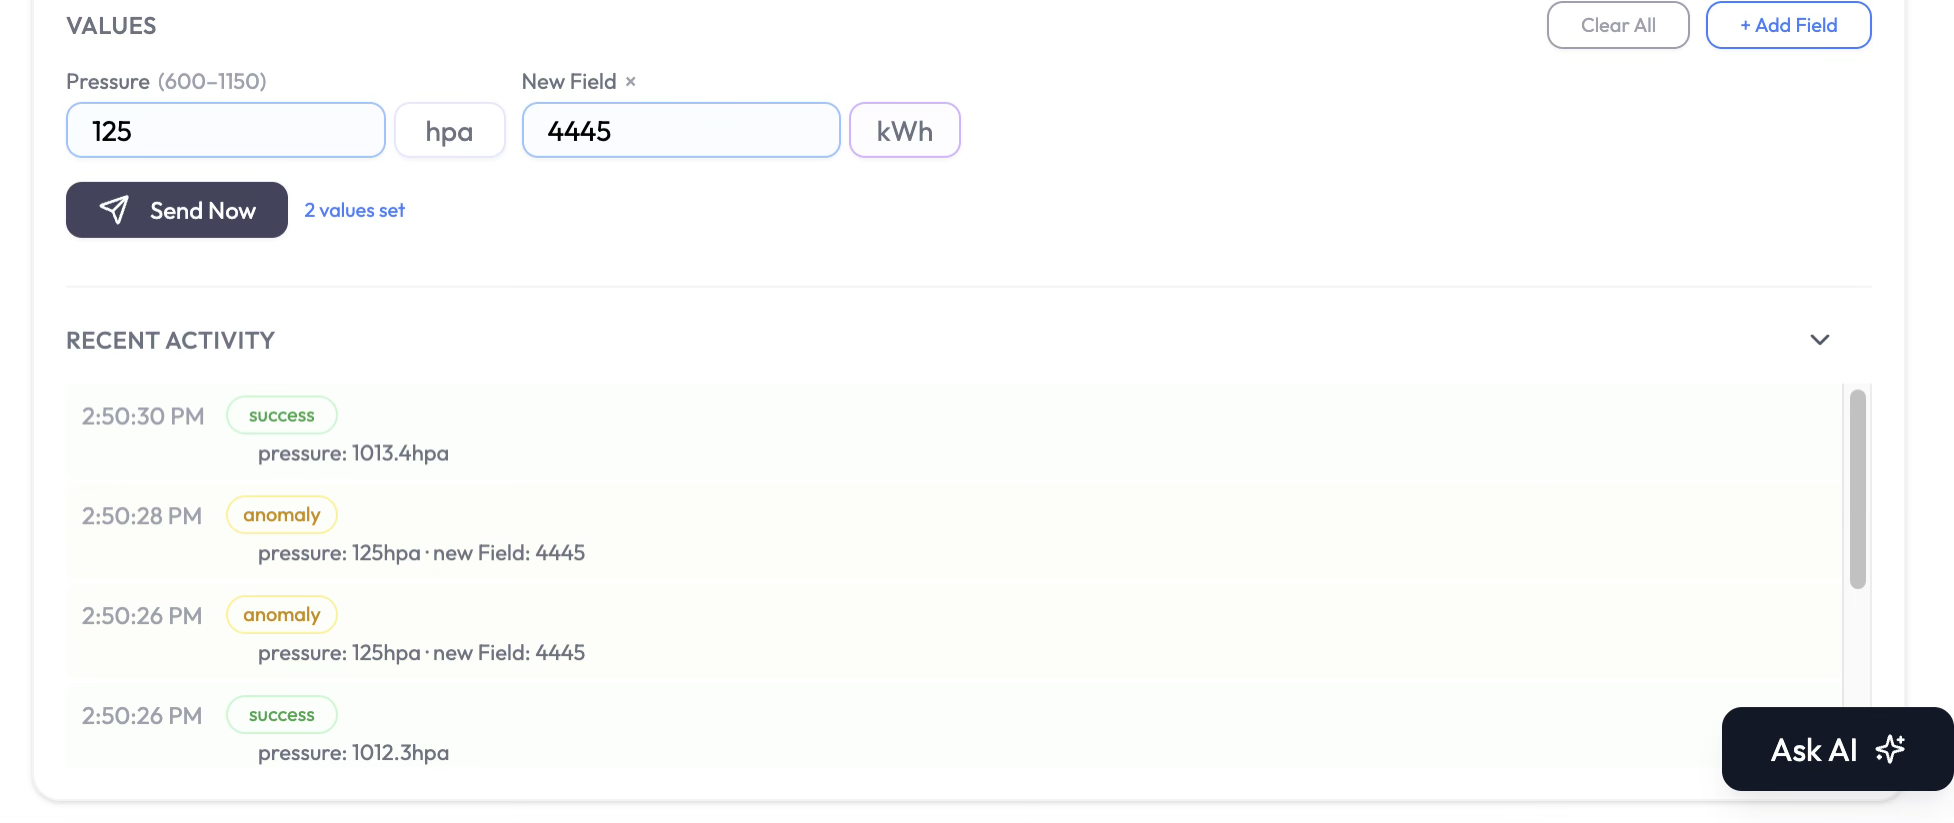
The Values section contains a text box for every field (also called Attributes) the device sends. Enter custom values and click Send Now to publish them immediately. This works only while both the gateway and the device are running.
Each device keeps a Recent Activity list showing the last 20 sends, with a status of success or anomaly. Scroll the list to inspect exactly what was sent. Values outside the normal range are marked as anomaly.
Step 8 — Test alerts and anomaly detection (Optional)
This is the main reason to customize a device’s values: you can deliberately send readings that fall outside normal limits and confirm that your alerts and anomaly detection respond as expected.
Set up before you test:
- Alerts are created in the Alerts section of the Application.
- Default anomaly detections are defined on the Application → Devices → Device → Edit → Alert Properties page.
Trigger and verify:
-
1
With the gateway and device running, open the Values section.
-
2
Enter a value that breaches your alert condition or the field’s expected range — for example, a pressure far outside the configured Min/Max.
-
3
Click Send Now. The send appears in Recent Activity; values flagged by anomaly detection are marked anomaly rather than success.
-
4
Confirm the alert fired through its configured channel (email and alerts page).
Step 9 — Send a raw payload (Optional)
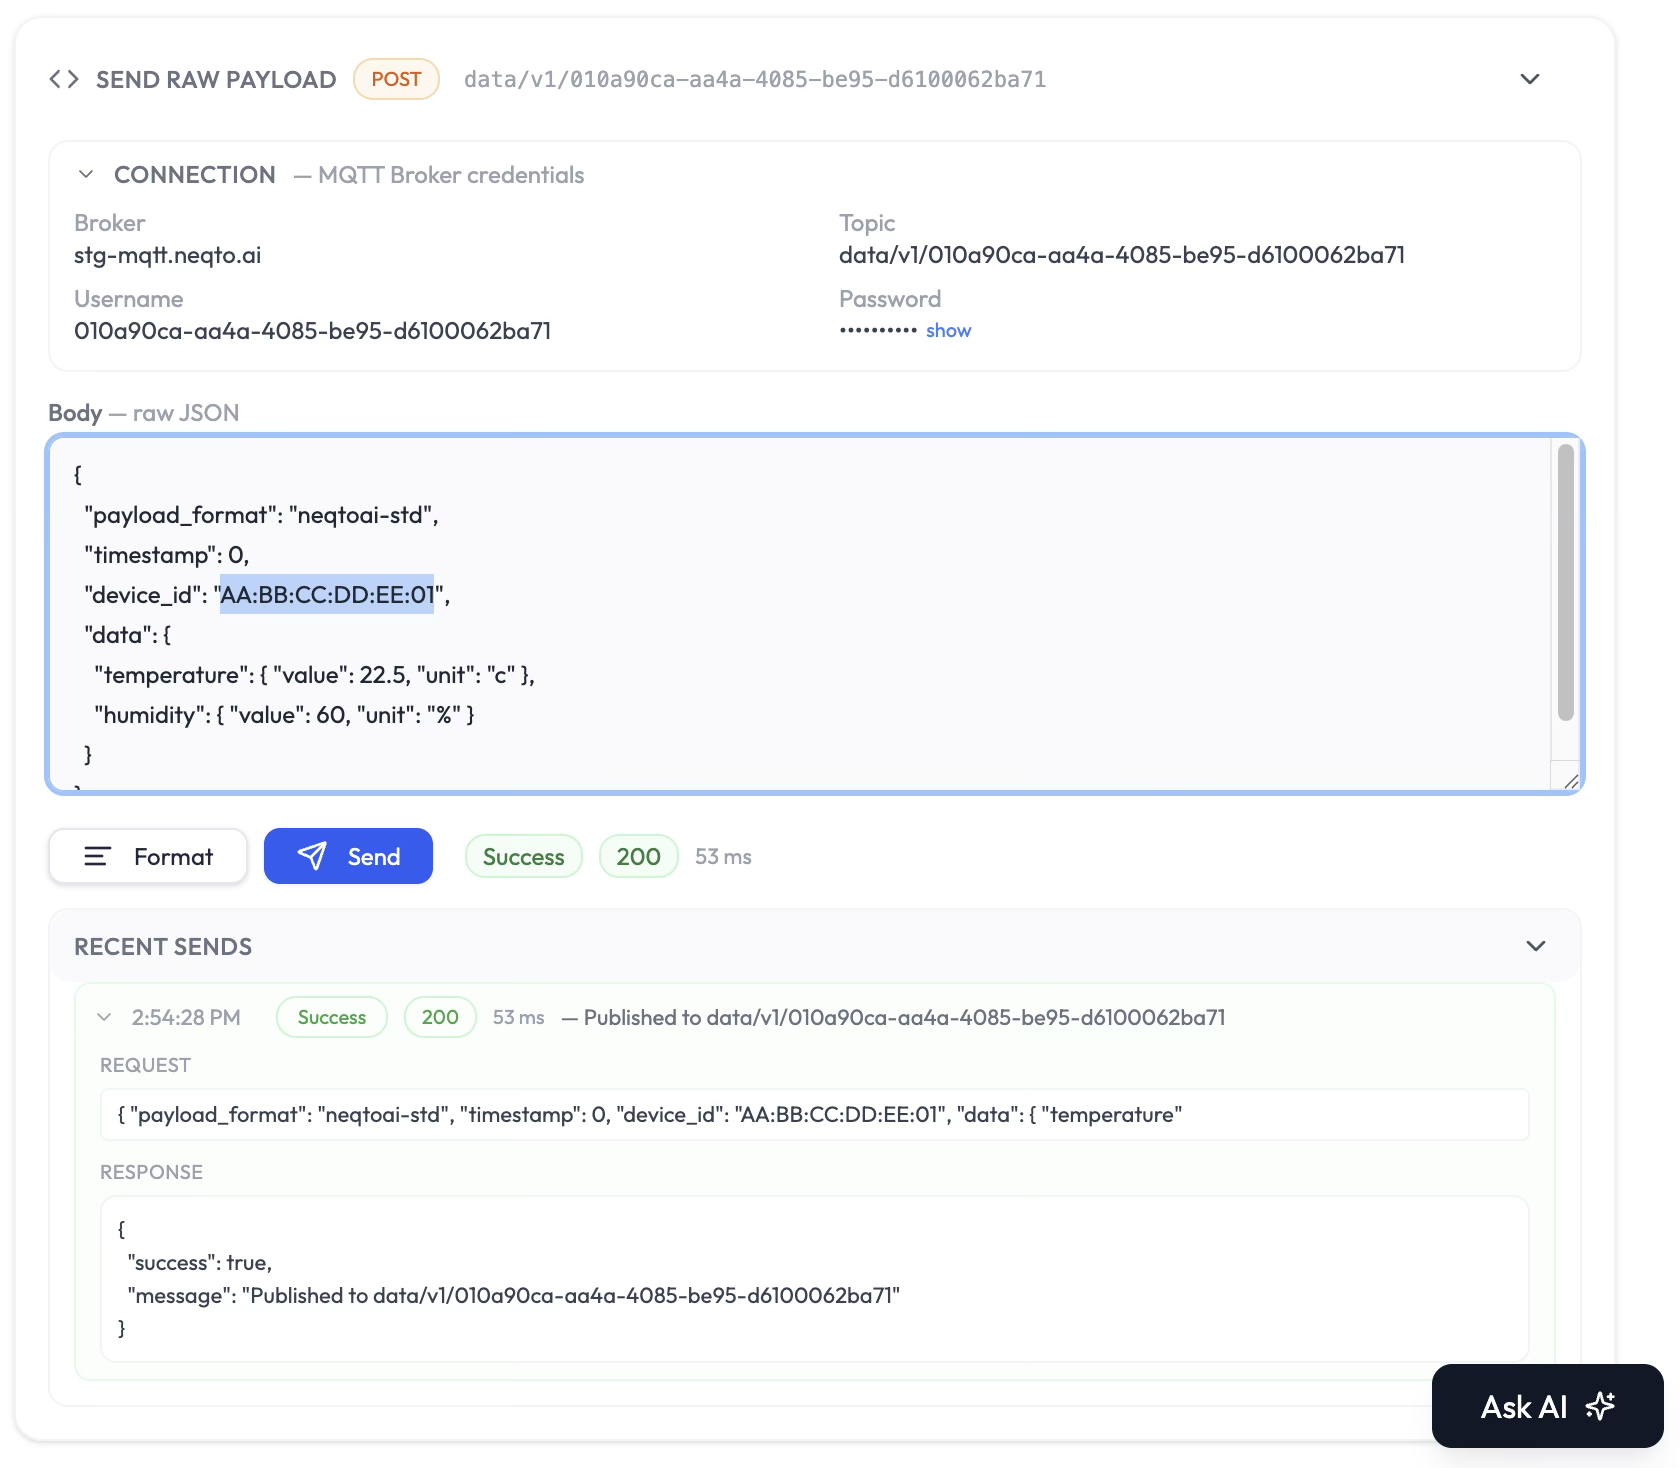
Send Raw Payload lets you publish a hand-written JSON message directly to the gateway’s topic — the best way to validate a payload format before a real device sends it. Any payload that is accepted will appear as a device in the device list.
-
1
Click Send Raw Payload to expand the panel. The Connection section shows the MQTT broker, topic, username, and password used for the send (the password is hidden until you click show).
-
2
Edit the JSON in the Body box. A typical NEQTO standard payload looks like this:
{ "payload_format": "neqtoai-std", "timestamp": 0, "device_id": "AA:BB:CC:DD:EE:01", "data": { "temperature": { "value": 22.5, "unit": "c" }, "humidity": { "value": 60, "unit": "%" } } }- payload_format — identifies the payload schema (e.g.
neqtoai-std). - timestamp — send time; use
0to let the platform timestamp on receipt. - device_id — unique identifier for the device within the system.
- data — an object of fields, each with a
valueand aunit.
- payload_format — identifies the payload schema (e.g.
-
3
Click Format to tidy the JSON, then Send. The result (status, response code, and timing) is shown next to the button and recorded under Recent Sends, which keeps the full request and response for each send.