Endpoints & Devices is where your real-world data enters NEQTO.ai. An Endpoint is the connection your hardware talks to. A Device is a single piece of equipment sending data. An Attribute is one measurement that device reports, such as temperature, humidity, or battery. Get these three right and everything else (dashboards, alerts, analytics, maps) just works.

Data reaches NEQTO.ai in two ways. Most devices publish to a Device Endpoint, as shown above. A device can also be created from an Integration — data pulled in from an external cloud service, rather than published by the device itself. Either way it becomes a Device with auto-mapped Attributes. Every device is labelled by its Source (Endpoint or Integration) so you can tell the two apart; see the Source column on the Devices list below.
Quick Start
If you already know NEQTO.ai, here is the short version.
-
1Open an application and go to Device Endpoints. Click Add Device Endpoint and pick a connectivity type: MQTT, HTTPS, or WSS.
-
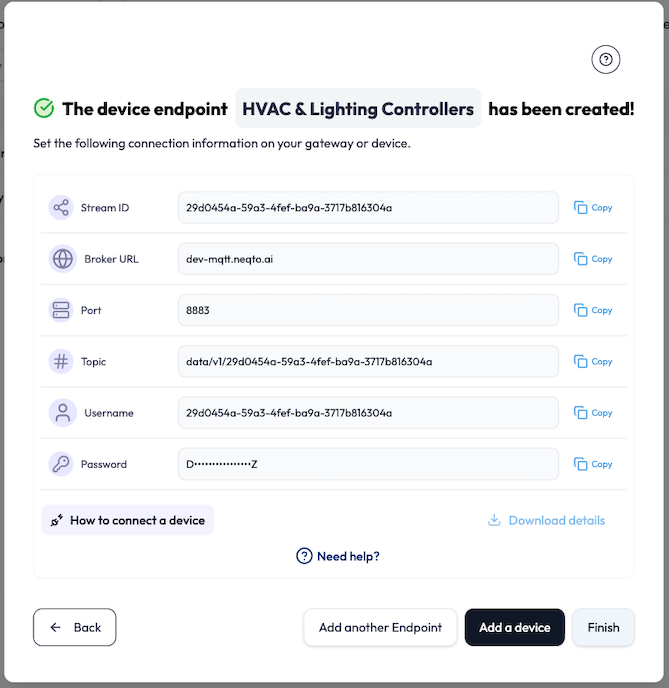
2Copy the credentials shown on the final step (Stream ID, host/URL, port, username, password, and the CA certificate). Use Download details to save them all, or copy each value with its own copy button.
-
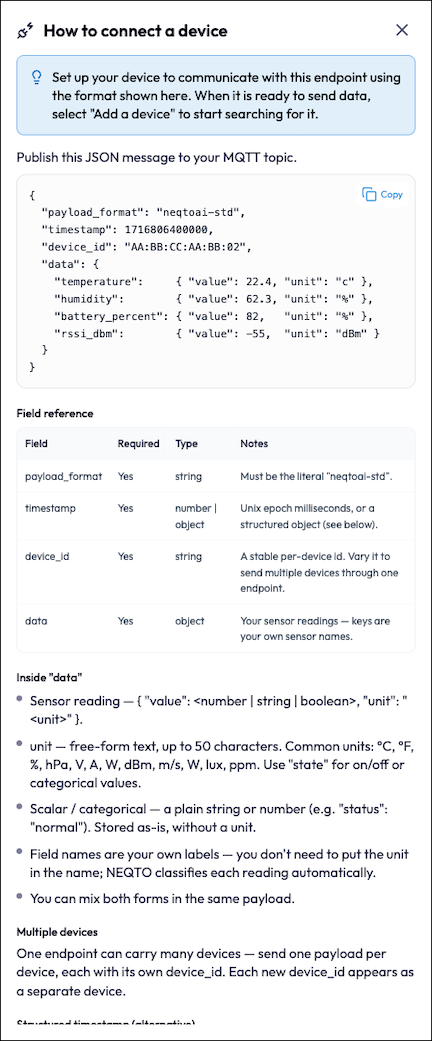
3Open How to connect a device and send the
neqtoai-stdJSON payload shown there. No hardware yet? Create a Demo endpoint and use the built-in Simulator instead. -
4Within seconds the Device appears (identified by its
device_id) and its Attributes are auto-detected from the payload. Open the device to see live data, then build a dashboard or an alert.
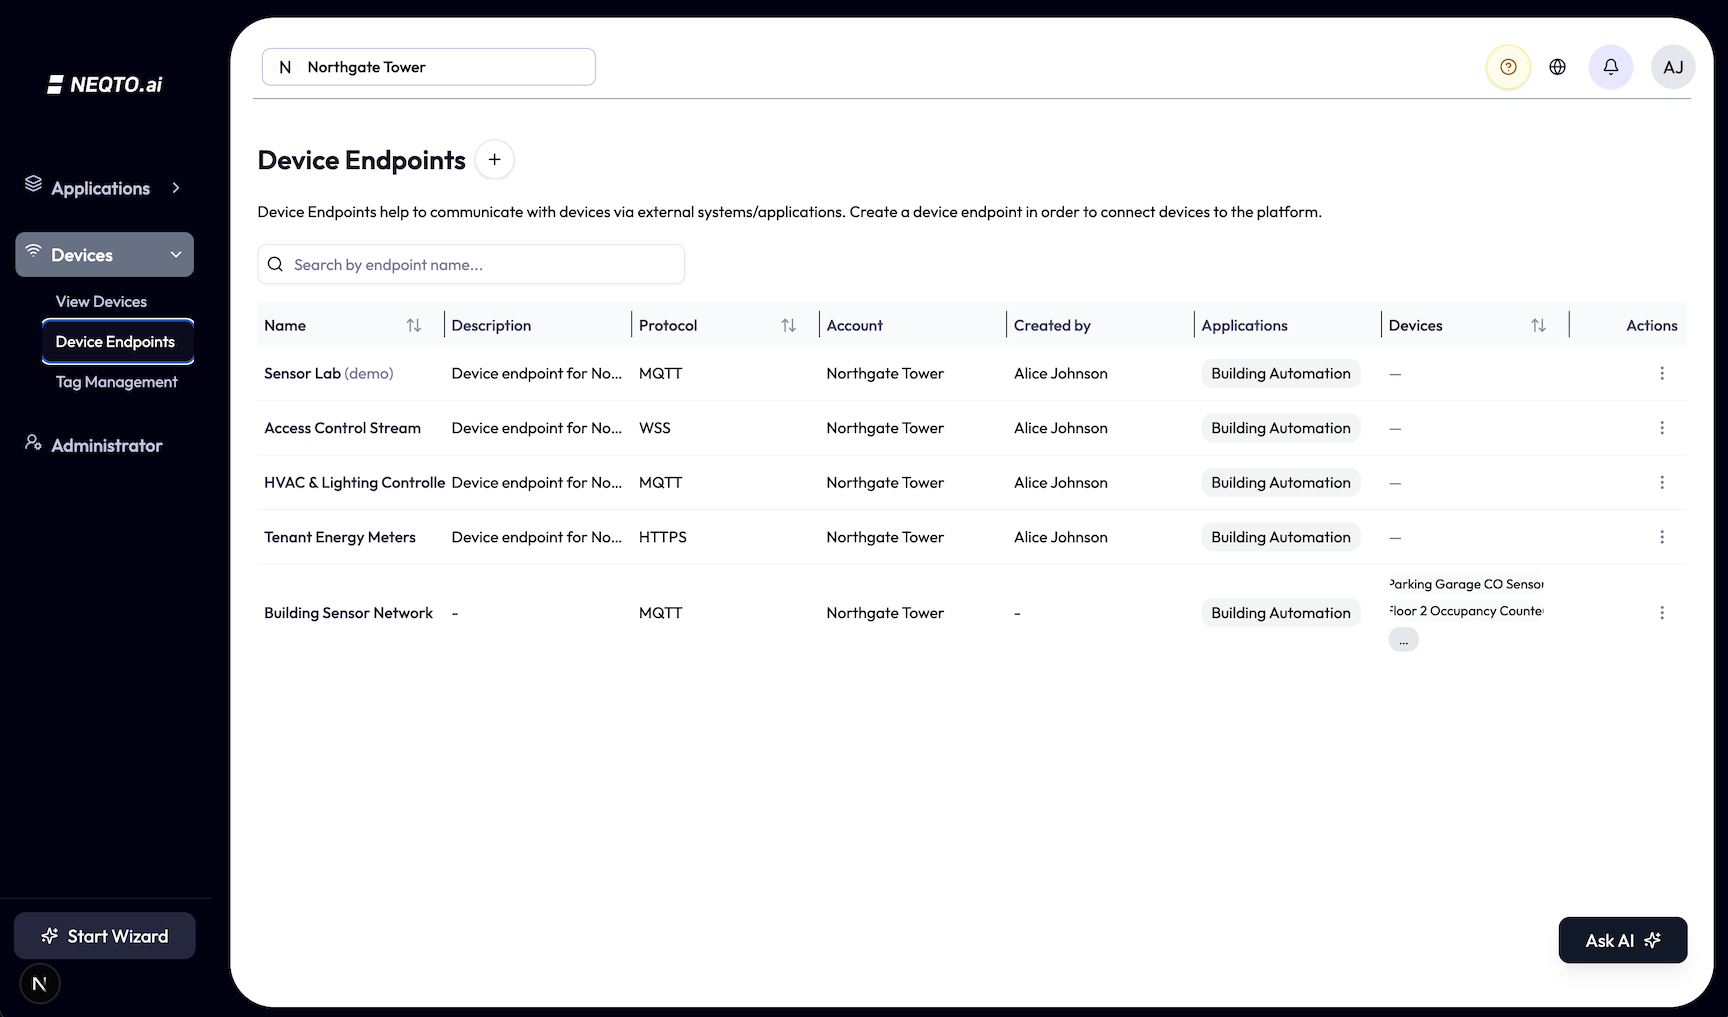
Device Endpoints
An Endpoint is a secure inbound channel. It owns the connection settings and credentials, and the devices that publish to it are grouped underneath it.
Connectivity types
You choose the type when you create the endpoint, and it cannot be changed afterward.
| Type | Use it for | You receive |
|---|---|---|
| MQTT | Most IoT devices and gateways. Persistent, low-overhead connection. | Stream ID, broker URL, port, topic, username, password, and a CA certificate. |
| HTTPS | Devices, scripts, or services that push data with an HTTP request. | Stream ID, an ingestion URL, port, method (POST), a CA certificate, and (with Basic Authentication) a username and password. Max payload 1 MB per request. |
| WSS | Apps and gateways that keep a live WebSocket open and stream frames. | Stream ID, a secure WebSocket URL, port, a CA certificate, and (with Basic Authentication) a username and password. |
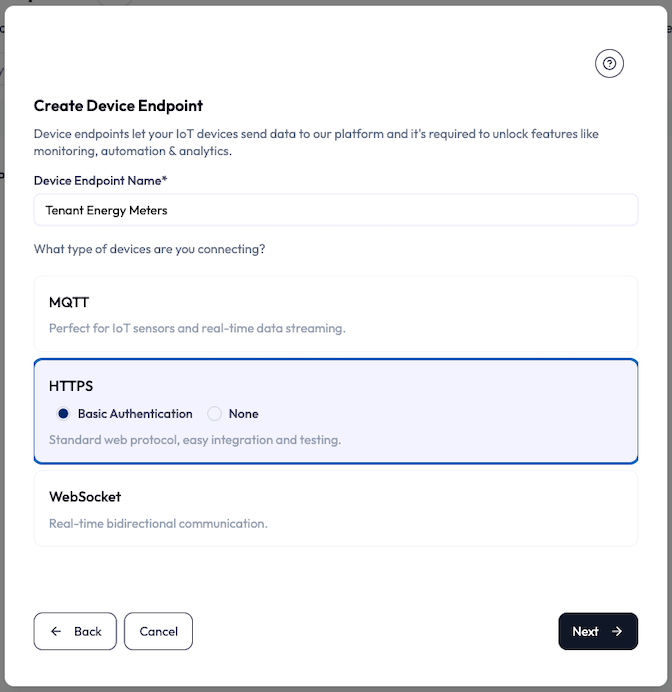
Each type also has an Authentication Type. For MQTT the choices are “MQTT with TLS (Recommended)” (a security token over a TLS connection) or “MQTT with no TLS” (username and password). For HTTPS and WSS the choices are “Basic Authentication” (username and password) or “None”. The older fully unencrypted HTTP and WS variants have been retired, so only the secure HTTPS and WSS types are offered.
Create an endpoint
Click Add Device Endpoint. You first choose how to set it up: Create Device Endpoint (a new one), Create Demo Device Endpoint (for the Simulator), Use an existing Device Endpoint (shown only when you already have one), or Create Aruba Device Endpoint (the HPE Aruba integration). Choosing Create Device Endpoint opens the form below.
-
1Enter a Device Endpoint Name (required).
-
2Pick the connectivity type (MQTT, HTTPS, or WebSocket) and, where there is more than one option, its authentication type. The connectivity type is fixed once created. To change it, you create a new endpoint.
-
3If you have permission to manage applications, you can assign the endpoint to applications so the right teams can see it.
Sending Data: the Payload Format
This is the part that makes or breaks a connection. NEQTO.ai expects one canonical JSON envelope
called neqtoai-std. Every endpoint has a built-in
How to connect a device helper that shows this payload tailored to your
endpoint’s protocol, with a field reference and troubleshooting tips.
payload_format to exactly the string
"neqtoai-std". Without it your readings will not be recognized as the standard
format, so the device may not appear or its values may be missing, and no error is returned to
the device. This is the single most common reason a connection looks successful but no data
lands.
The canonical payload
Send this JSON to your endpoint. Keys inside data are your own sensor names; you do
not need to encode units into the names.
{
  "payload_format": "neqtoai-std",
  "timestamp": 1716806400000,
  "device_id": "AA:BB:CC:AA:BB:02",
  "data": {
    "temperature":     { "value": 22.4, "unit": "c" },
    "humidity":        { "value": 62.3, "unit": "%" },
    "battery_percent": { "value": 82,   "unit": "%" },
    "rssi_dbm":        { "value": -55,  "unit": "dBm" }
  }
}
Envelope fields
| Field | Required | Type | Notes |
|---|---|---|---|
payload_format |
Yes | string | Must be the literal "neqtoai-std". |
timestamp |
Yes | number or object | Unix epoch milliseconds, or a structured object (see below). |
device_id |
Yes | string | A stable per-device id. This becomes the device’s External ID in the UI. Vary it to send multiple devices through one endpoint. |
data |
Yes | object | Your sensor readings. The keys are your own sensor names. |
Inside the data object
-
Sensor reading:
{ "value": <number | string | boolean>, "unit": "<unit>" }. -
Unit: free-form text, up to 50 characters. Common units:
°C,°F,%,hPa,V,A,W,dBm,m/s,lux,ppm. Use"state"for on/off or categorical values. -
Scalar / categorical: a plain string or number, for example
"status": "normal". Stored as-is, without a unit. - Naming: field names are your own labels. You do not need to put the unit in the name; NEQTO.ai classifies each reading automatically.
- Mixed: you can mix the reading and scalar forms in the same payload.
Multiple devices through one endpoint
One endpoint can carry many devices. Send one payload per device, each with its own
device_id. Each new device_id appears as a separate device.
Structured timestamp (alternative)
Instead of Unix milliseconds you can send a structured object. The offset uses the
±HHMM convention.
"timestamp": {
  "year": "2026", "month": "05", "day": "26",
  "hour": "14", "minute": "30", "second": "00",
  "offset": "+0900"
}
How to deliver it
| Protocol | How to send |
|---|---|
| MQTT | Publish the JSON message to your MQTT topic. |
| HTTPS | Send the JSON as an HTTP POST to your endpoint URL. |
| WSS | Send the JSON over your WebSocket connection as a text frame. |
Troubleshooting
| Symptom | Likely cause |
|---|---|
| Connection or TLS handshake fails | Wrong host or port, or connecting without TLS. Check the endpoint details on the credentials summary. |
| Authentication is rejected | Username or password does not match, or the endpoint was deleted or rotated. |
| Connected, but no device appears | Publishing to the wrong topic or URL (the endpoint ID must match), or the payload could not be parsed. |
| Device appears, but readings are missing |
The data object is empty or malformed, or payload_format is not set to
"neqtoai-std".
|
neqtoai-std.
Managing endpoints
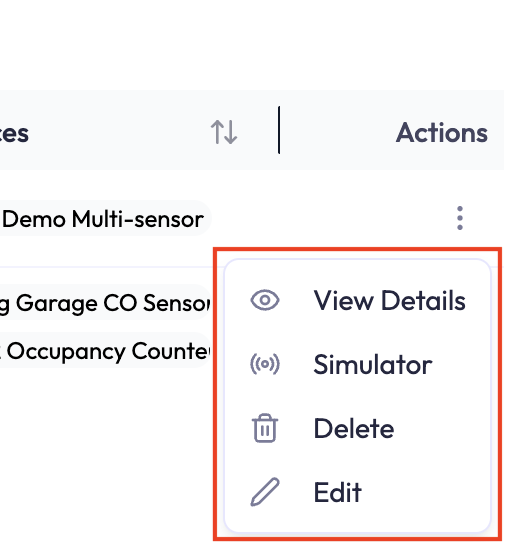
Each row in the Device Endpoints table has an actions menu. Click the ⋮ (three-dot) icon in the Actions column on the right of the row to open it. This is where you reach Edit (to rename the endpoint) and, on demo endpoints, the Simulator.
- Search the list by endpoint name.
- View Details re-opens the credentials summary and lists every device currently publishing to the endpoint.
- Simulator opens the built-in Simulator (shown only for demo endpoints, inside an application, and only when you have the Simulator view and execute permissions). See below.
- Edit changes only the name and description. Connection settings stay fixed.
- Delete removes the endpoint after a confirmation. Devices that depended on it stop receiving data.
Devices
A Device is one physical thing reporting data. Most appear on their own when data arrives, but you can also add one manually, which is useful for pre-registering hardware before it ships or before it is powered on.
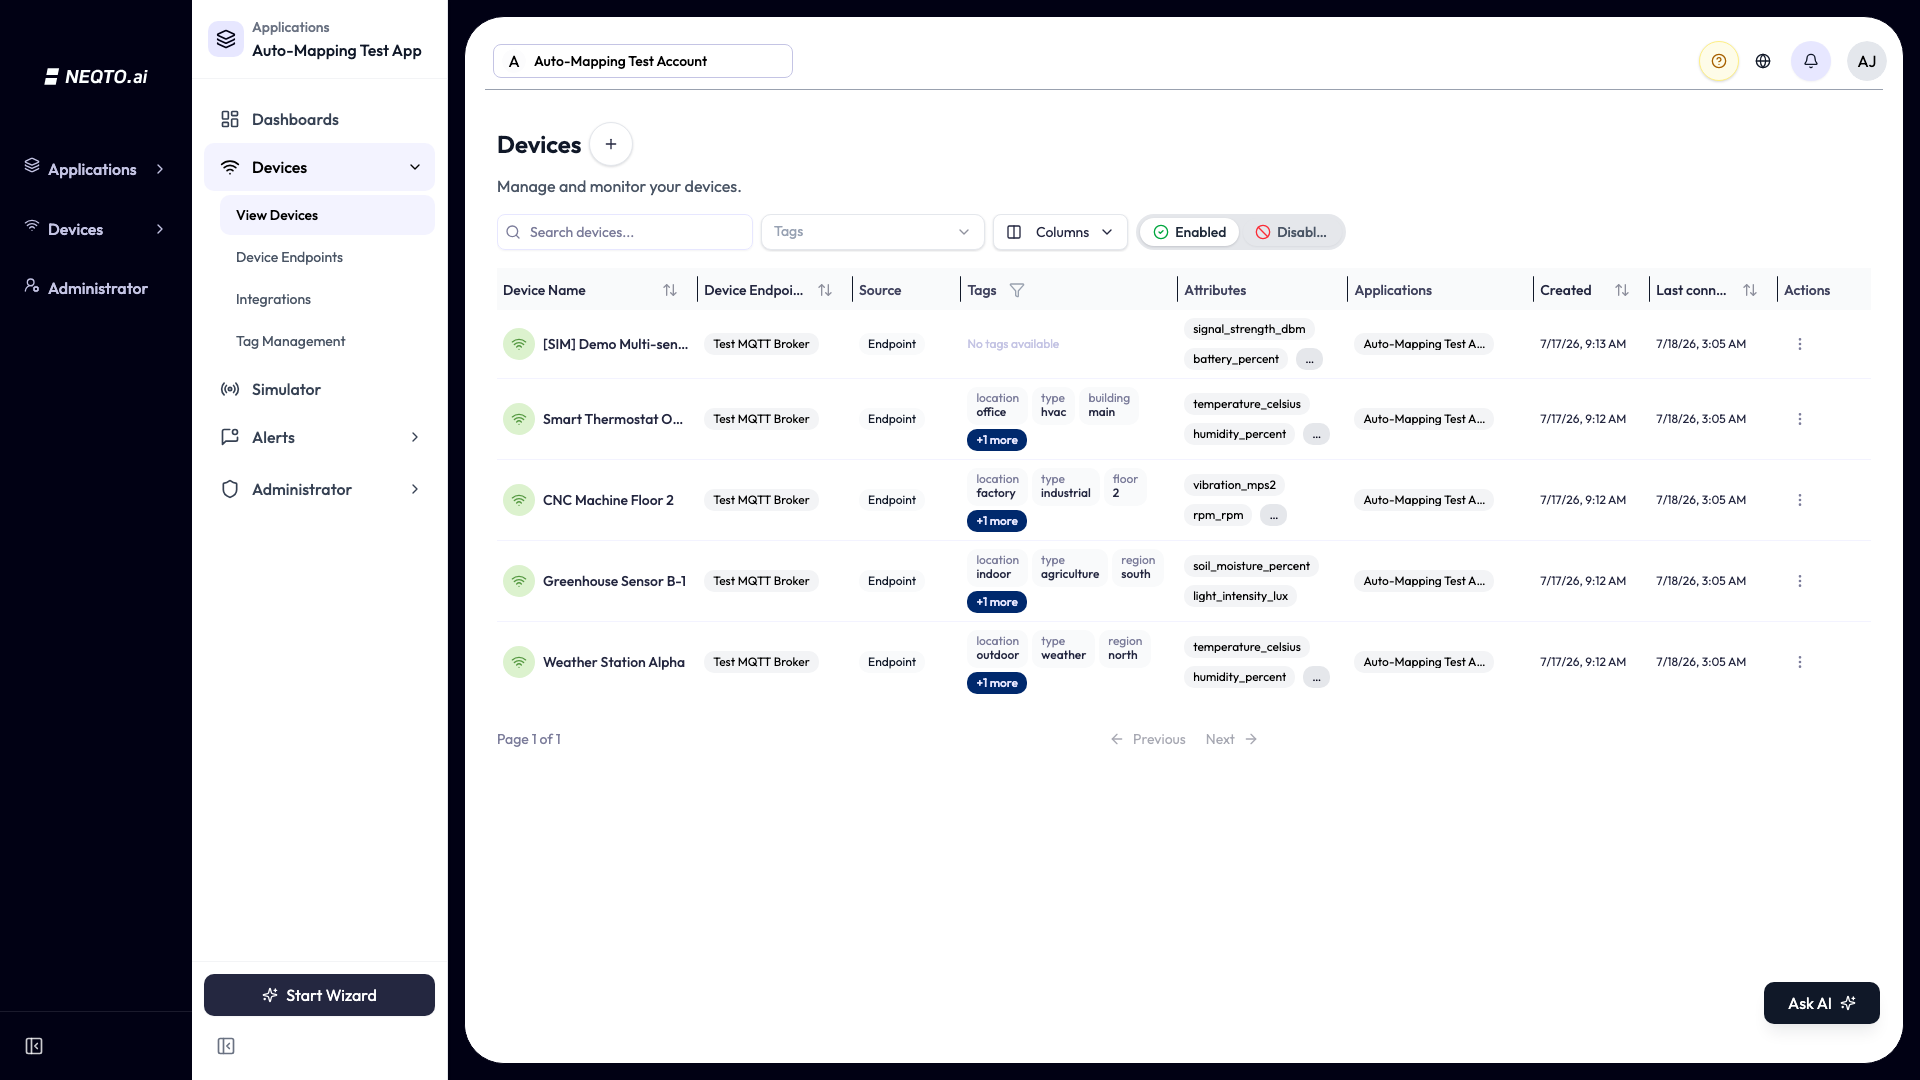
The list view
- Connectivity shows next to each device name: green Wi-Fi when connected, red when not.
- Source shows how each device entered NEQTO.ai: an Endpoint badge for devices that publish to a Device Endpoint, or an Integration badge (with the integration’s name beside it) for devices pulled in from an external service through an Integration. This column is shown by default.
- Search by name, and filter by tag — either from the toolbar Tags filter or the Tags column header.
- Switch between Enabled and Disabled devices with the toggle. Disabled devices are ones you have soft-deleted.
- Sort by most columns, including Last connected to surface quiet devices.
- Choose your columns with the Columns control. Several (External ID, Vendor, Model, Account, Notes, Profiles) are hidden by default, and your choice is remembered per application.
- Profiles shows how each device’s data is parsed: EnOcean (with its EEP), BLE, or STD. This column is hidden by default.
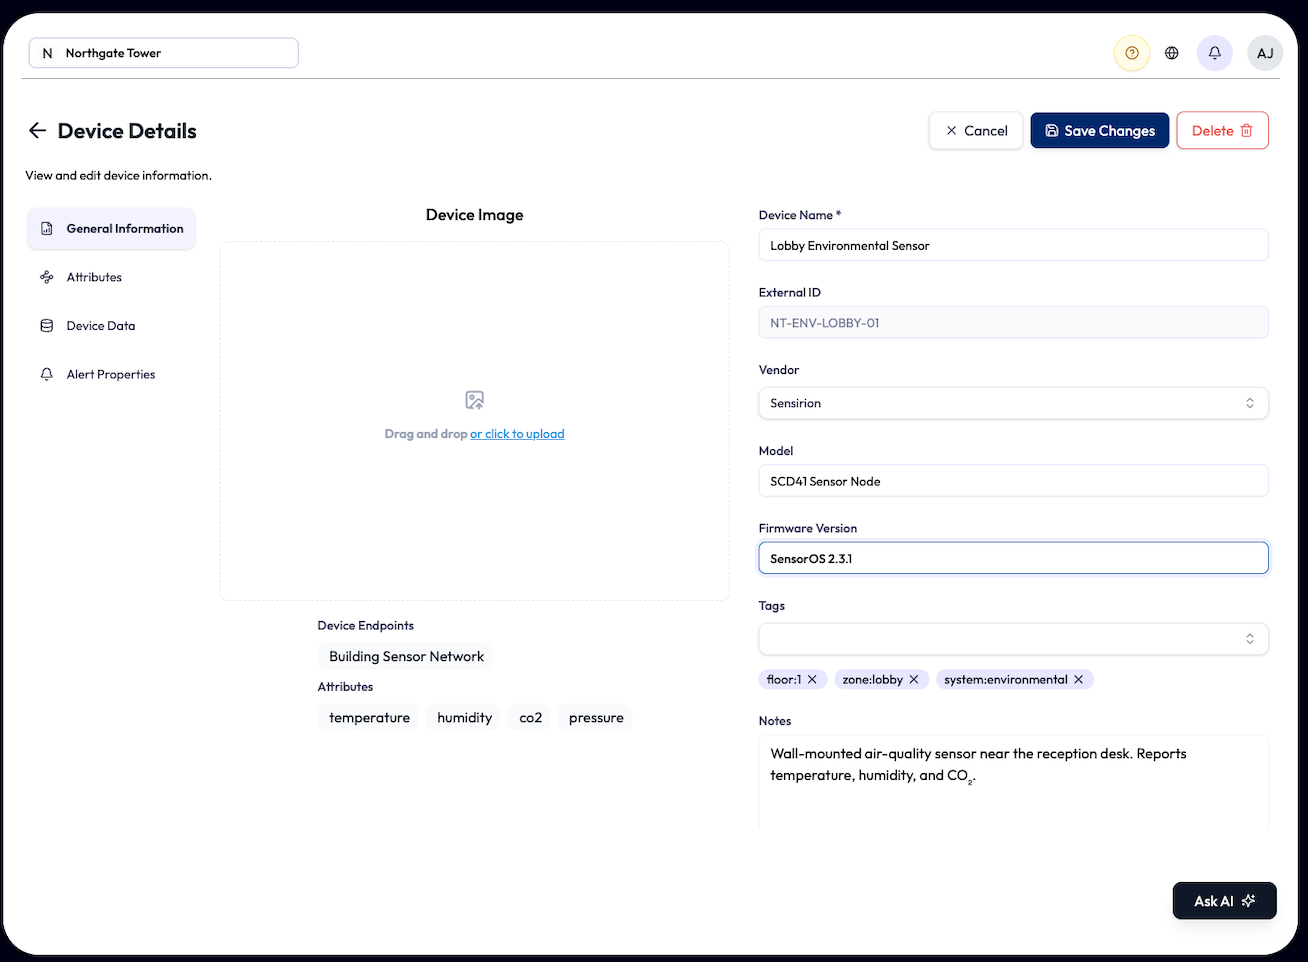
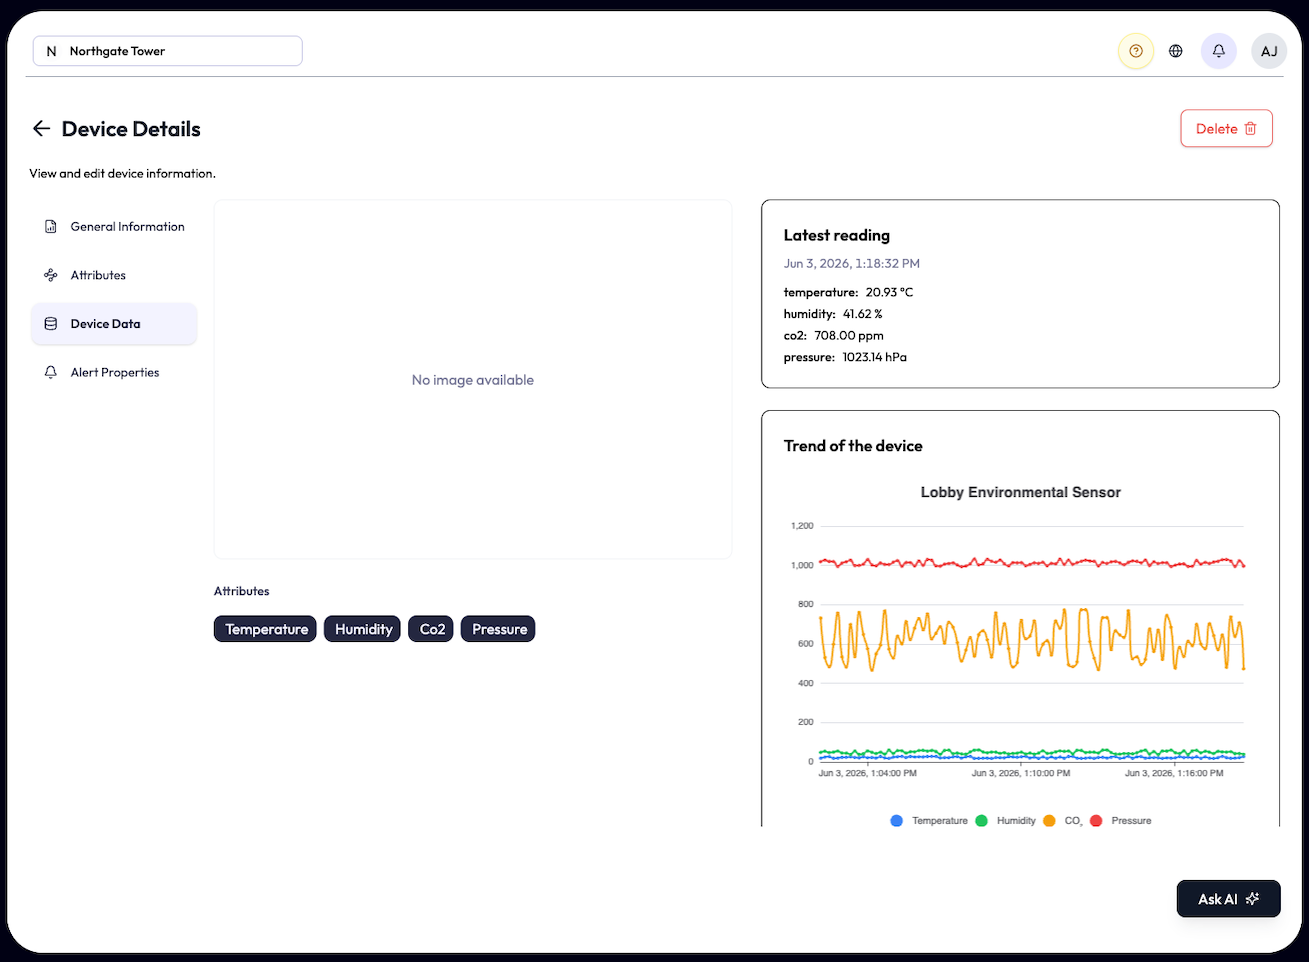
Device Edit (device details)
Click a device row, or choose View Details or Edit from its actions menu, to open the device page. The page is now titled Device Edit — the one place you both review and edit a device. It has these tabs:
| Tab | What’s there |
|---|---|
| General Information | Editable metadata: device name, vendor, model, firmware, tags, notes, and image. External ID is read-only. EnOcean devices also show an editable EEP selector (you pick the code from a dropdown). |
| Attributes | The auto-detected measurements for this device. See below. |
| Device Data | The live and recent payload values arriving from the device. |
| Connectivity Monitoring | Shown only inside an application: the device’s offline-timeout and connectivity-alert settings. See the Alerts page. |
| Anomaly Detection Settings | Shown only inside an application: per-sensor anomaly detection for this device. See the Alerts page. |
Connectivity: how “online” is decided
Organizing devices
-
Tags are key:value labels (for example
floor:3orsite:warehouse-A) you can filter the whole list by. See the Tags section for managing them. - Vendor and Model are device metadata you can show as columns and sort by; use Tags when you want to filter or group devices.
- Add to application from a device’s actions menu (on the main Devices list) to control which teams see it.
Disabling, restoring, and deleting
Removing a device is a two-stage, reversible process. From an active device’s actions menu, Disable is a soft-delete: the device moves to the Disabled list. From there you can Enable it to bring it back, or Permanently Delete it to remove it for good. Switch the list toggle to Disabled to see disabled devices and these actions.
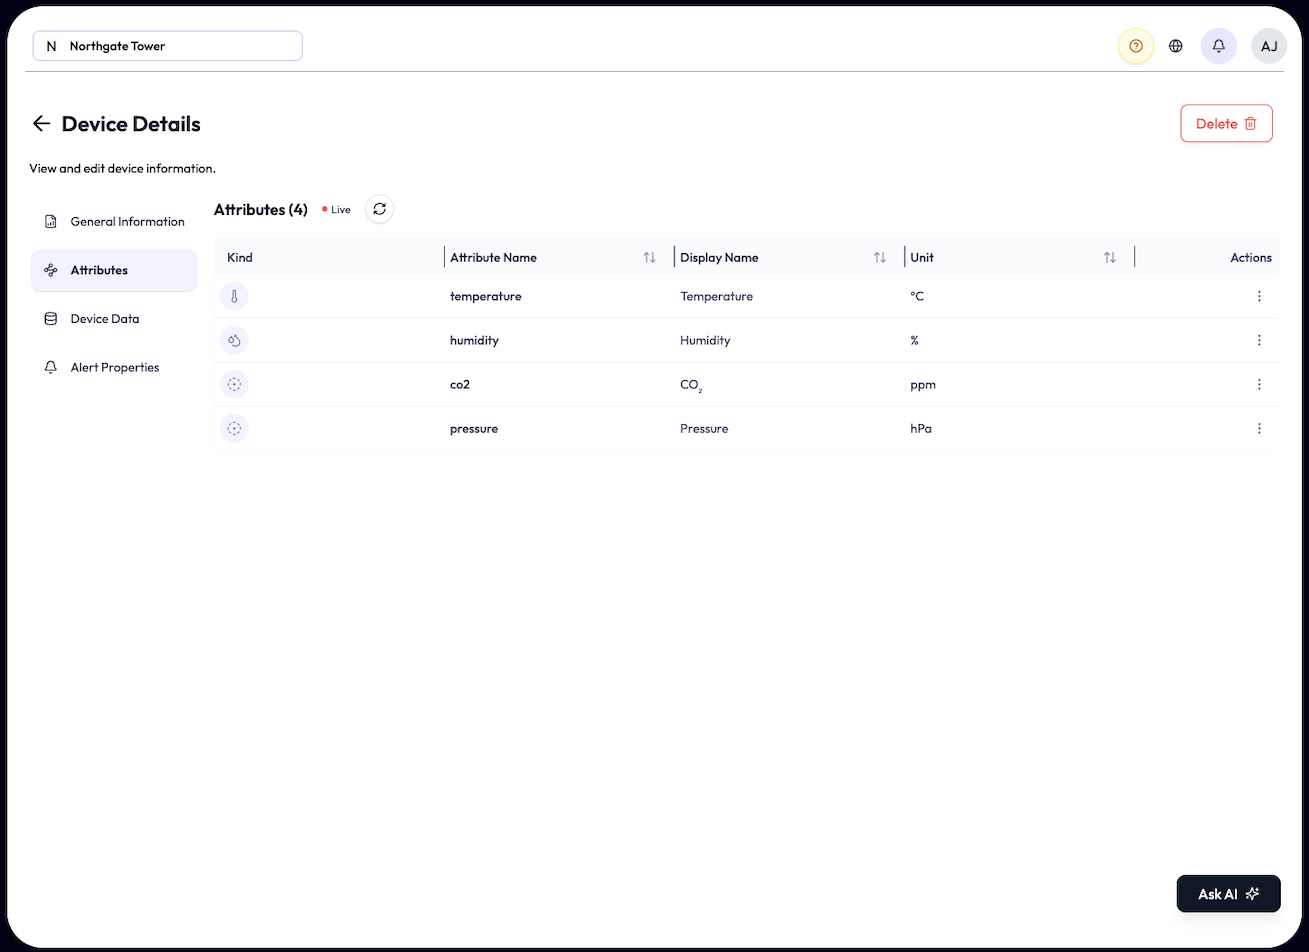
Attributes
An Attribute is a single measurement a device reports, such as temperature, humidity, battery, or occupancy. This is the part most platforms make you configure by hand. NEQTO.ai does it for you.
data object and creates an Attribute for each reading it finds, recording the exact
path to that value. You do not create or delete Attributes manually; they follow the data. The
first time a device sends a brand-new payload shape, NEQTO.ai works out what each field means.
Identical shapes after that are matched instantly.
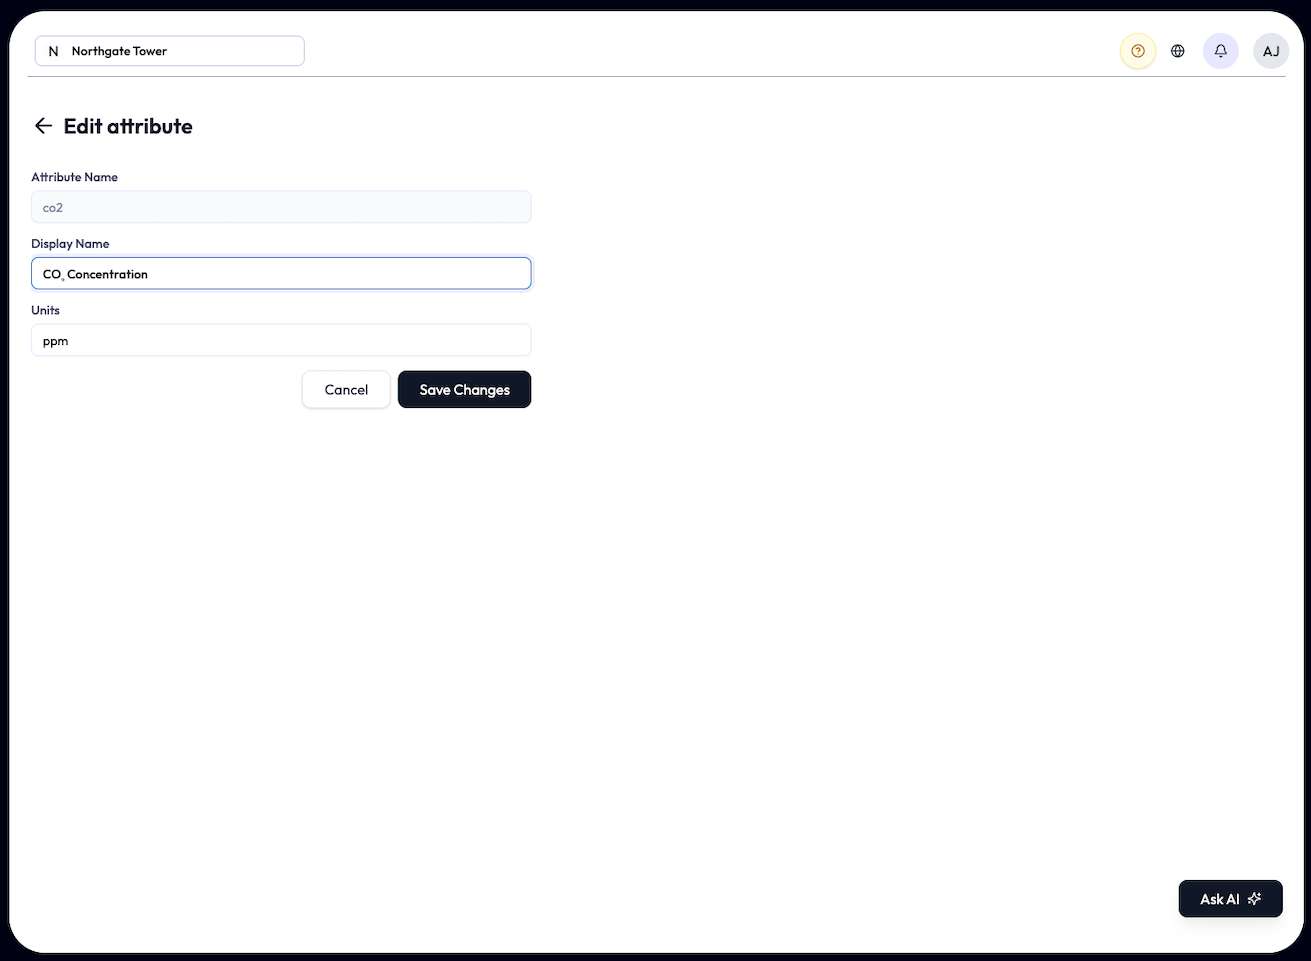
What you can edit
You cannot change what gets detected, but you can make it readable. Open the row’s actions menu and choose Edit:
-
Display Name: a friendly label (required, up to 255 characters), for example
rename
t1to “Supply air temp”. -
Units: the unit shown with the value (up to 50 characters), for example
°C,%, orhPa.
The underlying Attribute Name is fixed and shown read-only on the edit form.
Display Name and Units are account-scoped: a change applies everywhere that attribute appears across your account, for every user (the raw unit sent in the payload stays as the fixed mapping key — only the display unit shown in the UI changes). Permission to edit Attributes can be granted at the application level as well as the account level.
Demo Endpoints and the Simulator
No hardware? Create a Demo endpoint and drive it with the built-in Simulator to prototype dashboards, validate payloads, and test alerts and anomaly detection, all from a demo device endpoint.
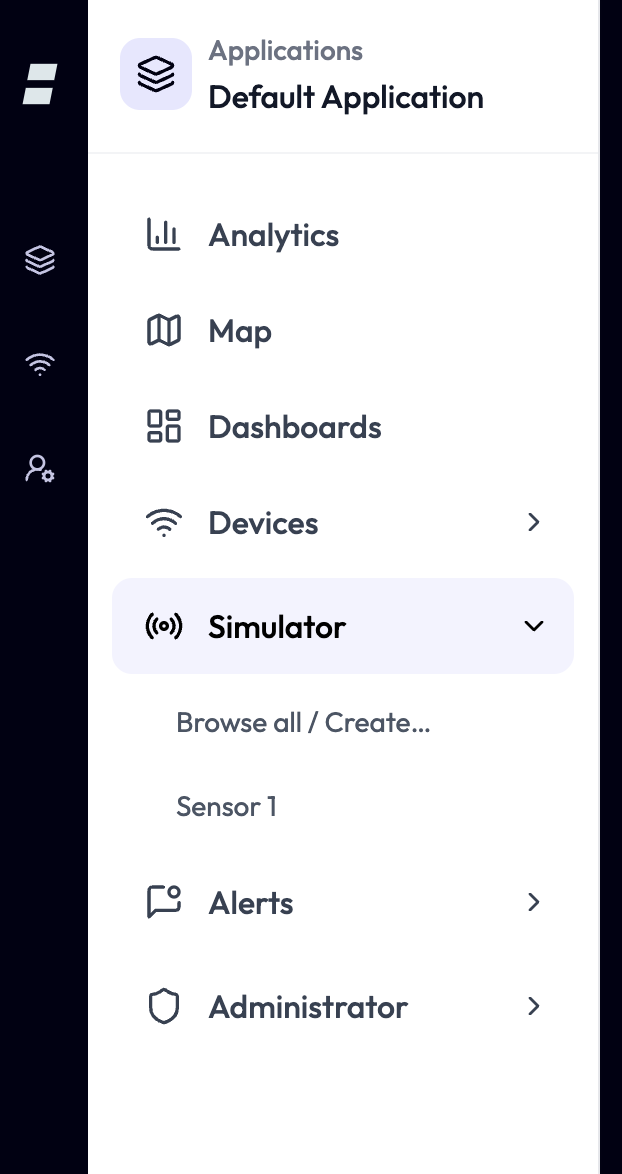
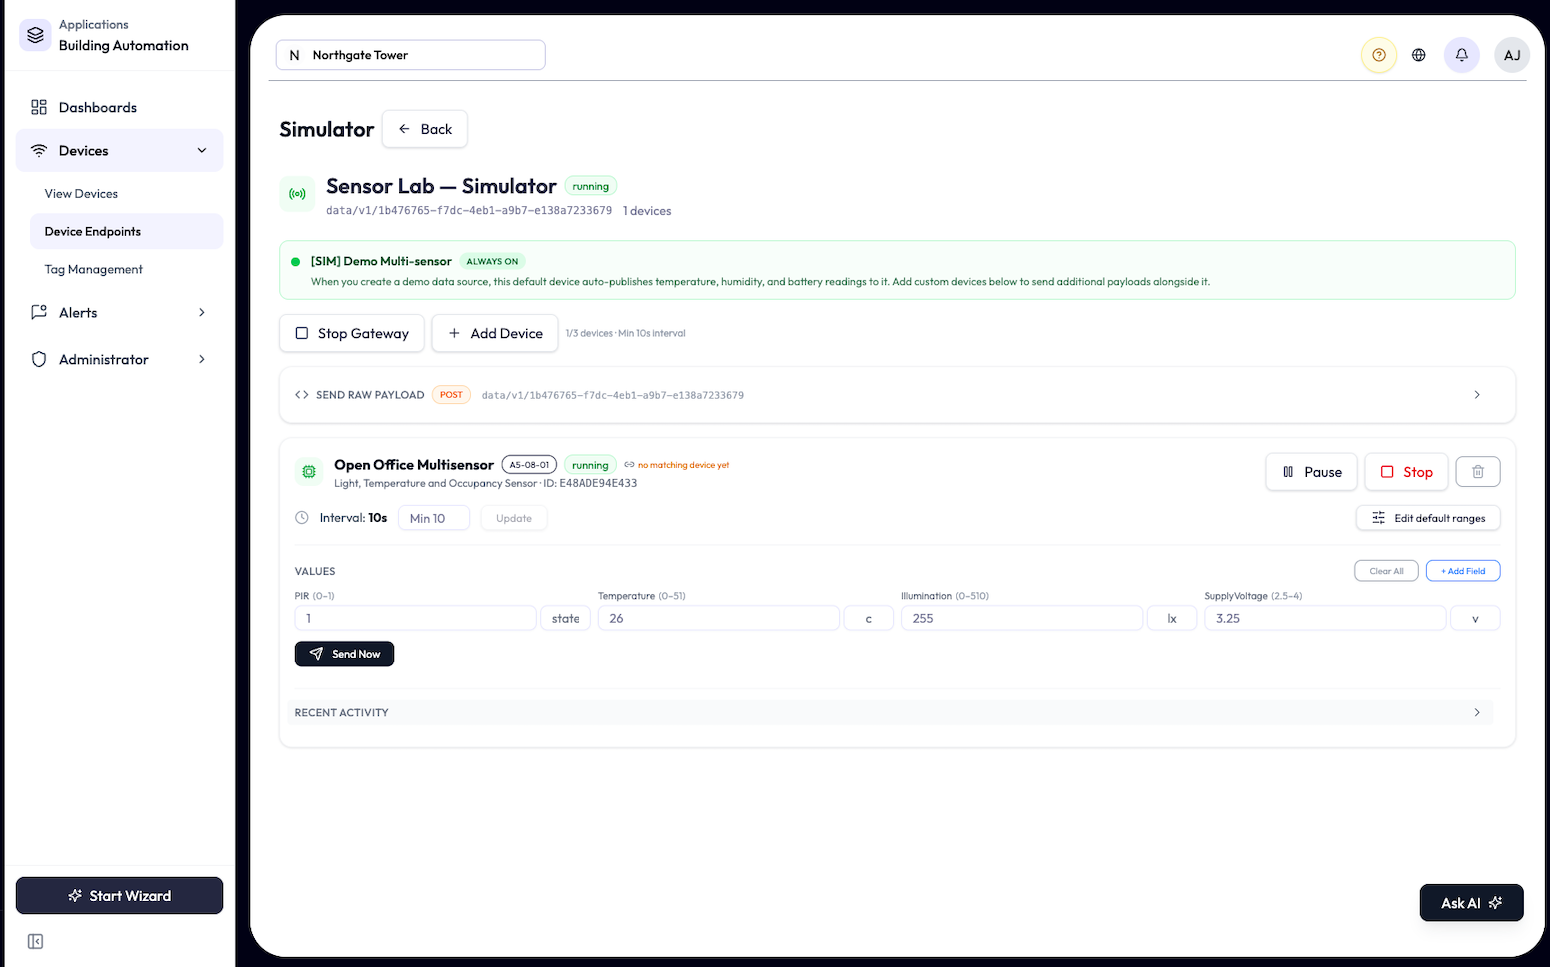
-
1Create a demo device endpoint from within an application (Device Endpoints, Add Device Endpoint, Create Demo Device Endpoint).
-
2Open the endpoint’s Simulator action. Use Add Device and pick a Device Template, give it a Device Name, and set an Interval (s).
-
3Start Gateway to begin publishing. Devices auto-register and their Attributes auto-map, exactly as real hardware would. You can also use Send Raw Payload to post a specific JSON shape, or adjust each device’s value ranges.
Simulated values follow realistic daily curves. Temperature and humidity rise and fall over the day, and occupancy or people-counts peak during business hours, so dashboards and alerts behave as they would in production.
How many devices and how fast they publish depends on your plan.
Limits and Good to Know
The per-plan figures match the plan cards in Billing; your account’s live limits come from the billing service and an Enterprise plan is custom.
| Limit | Value |
|---|---|
| HTTPS payload size | 1 MB per request |
| HTTPS request rate | Rate-limited per source |
| Connectivity timeout | 10 min minimum, 24 hr maximum |
- device_id is the key to everything. Keep it stable and unique per device. If it changes, NEQTO.ai treats the hardware as a new device.
- payload_format must be “neqtoai-std”. This is the number one cause of “connected but no data”.
- Endpoint type is permanent. Decide MQTT, HTTPS, or WSS up front.
- Quiet devices look offline. Match each device’s connectivity timeout to how often it actually reports.
- Let auto-mapping work. Send clean, consistently structured JSON and your Attributes stay tidy with no manual setup.