Widget Calculations let a widget perform arithmetic across the readings of two device attributes and display the result, instead of plotting each attribute on its own. Add (+), subtract (−), multiply (×), or divide (÷) the two attributes to show differences, sums, ratios, and other derived values — for example the gap between two temperatures, or a combined total across two sensors. This page covers how to configure a calculation on each widget type that supports it, the Strict Timestamp Mode option, and what a widget shows when a result cannot be computed.
- Chart — the X-axis is the shared timeline of the two attributes and the Y-axis plots the calculated trend over time.
- Single Status — shows one calculated value from the latest values of the two attributes.
- Multi Status — the same latest-value calculation, configurable per Device Attribute section, so calculated and non-calculated rows can be mixed in one table or list.
Single Status Widget
The steps below use a Single Status Gauge as the example. You configure a calculation from the widget’s create or edit screen, in the Attributes section.
-
1Open the widget editor. From your dashboard, open the create or edit screen for the target widget. For a Single Status widget the Attributes section starts in Single Mode with one Device Attribute row.
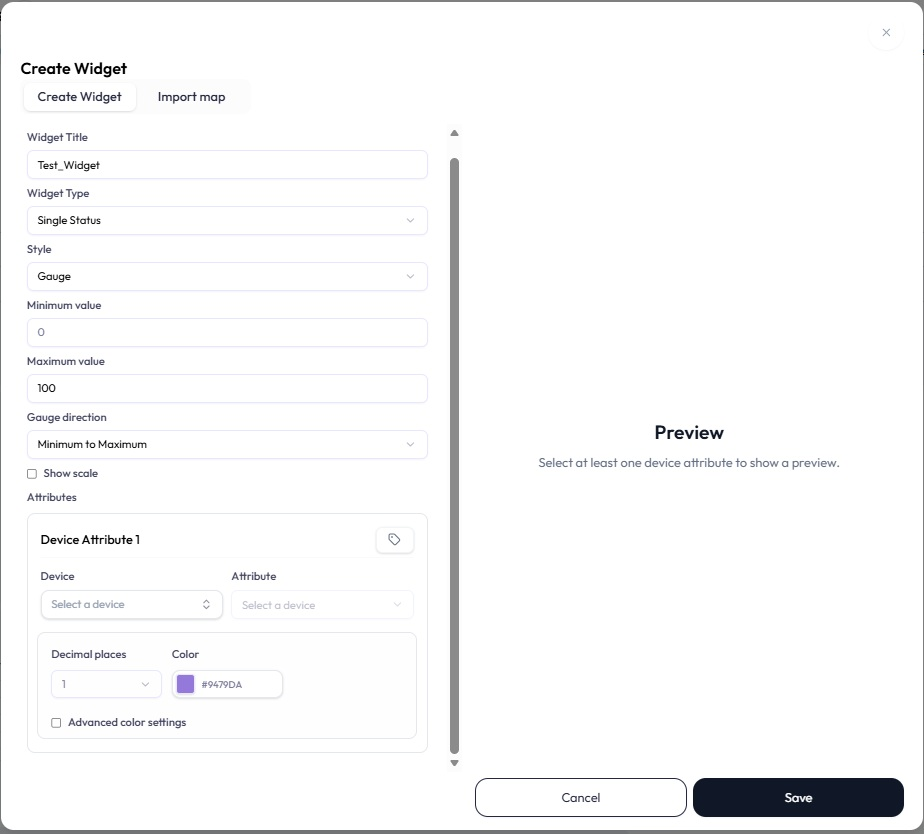
The widget editor opens in Single Mode with one Device Attribute row. -
2Switch to Multi Mode. In the Device Attribute section, click the Mode Switch button (the tag icon) to switch from Single Mode to Multi Mode. Clicking it again returns to Single Mode.
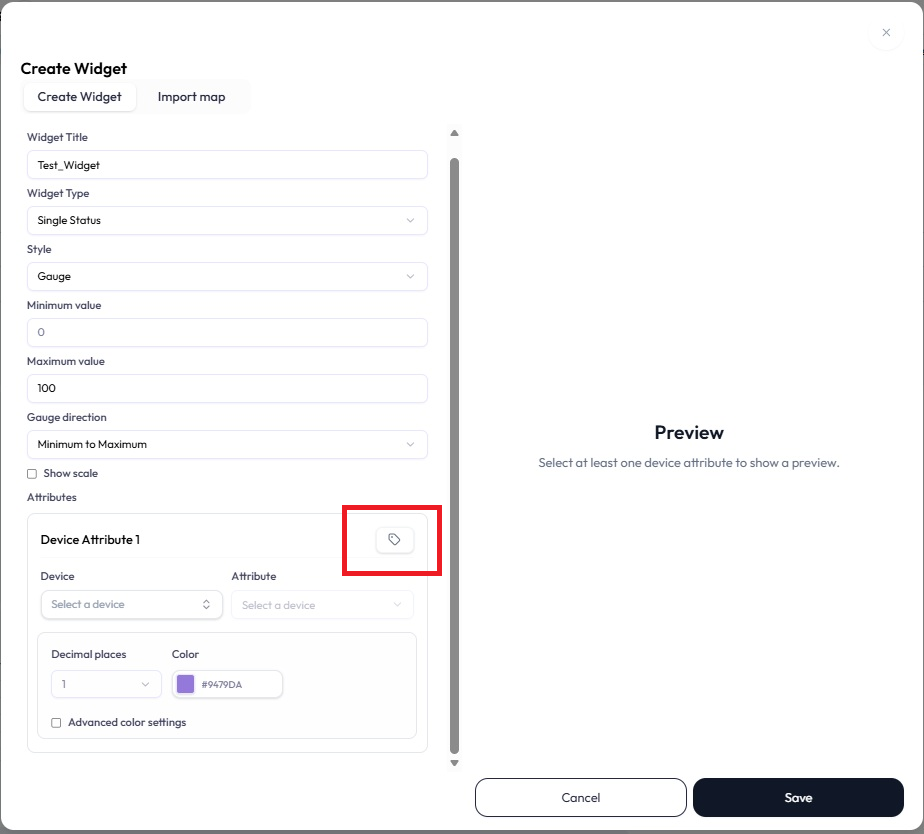
The Mode Switch (tag) button toggles the Device Attribute section into Multi Mode. -
3Select an operation type. In Multi Mode, operation buttons appear to the left of the Mode Switch button. Choose addition (+), subtraction (−), multiplication (×), or division (÷). The chosen operation is applied as attribute ① <operation> attribute ②.
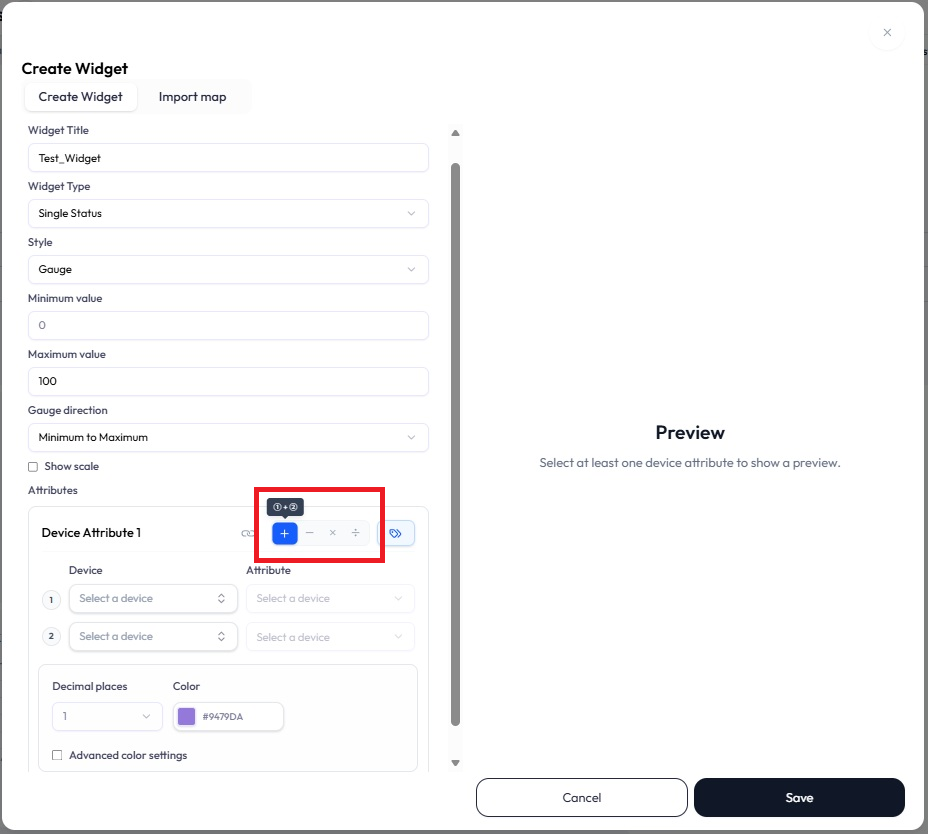
In Multi Mode, pick the operation applied between attribute ① and attribute ②. -
4Select the target attributes. Two numbered selectors (① and ②) each take a Device and an Attribute. Pick the device and attribute for each side of the calculation. Once both are set, the Preview shows the calculated result.
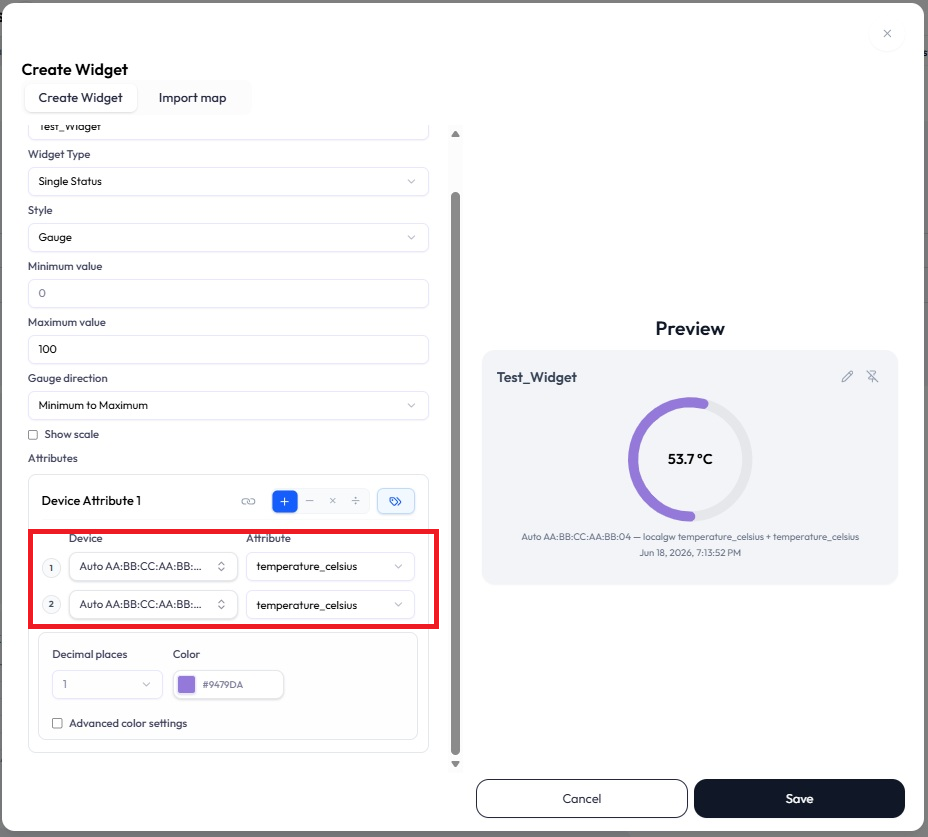
Set the device and attribute for ① and ②; the Preview updates with the calculated value. -
5Configure optional settings. Set any style options as needed, such as the Color, the number of Decimal places, and (for a Gauge) Advanced color settings — exactly as you would for a non-calculated widget.
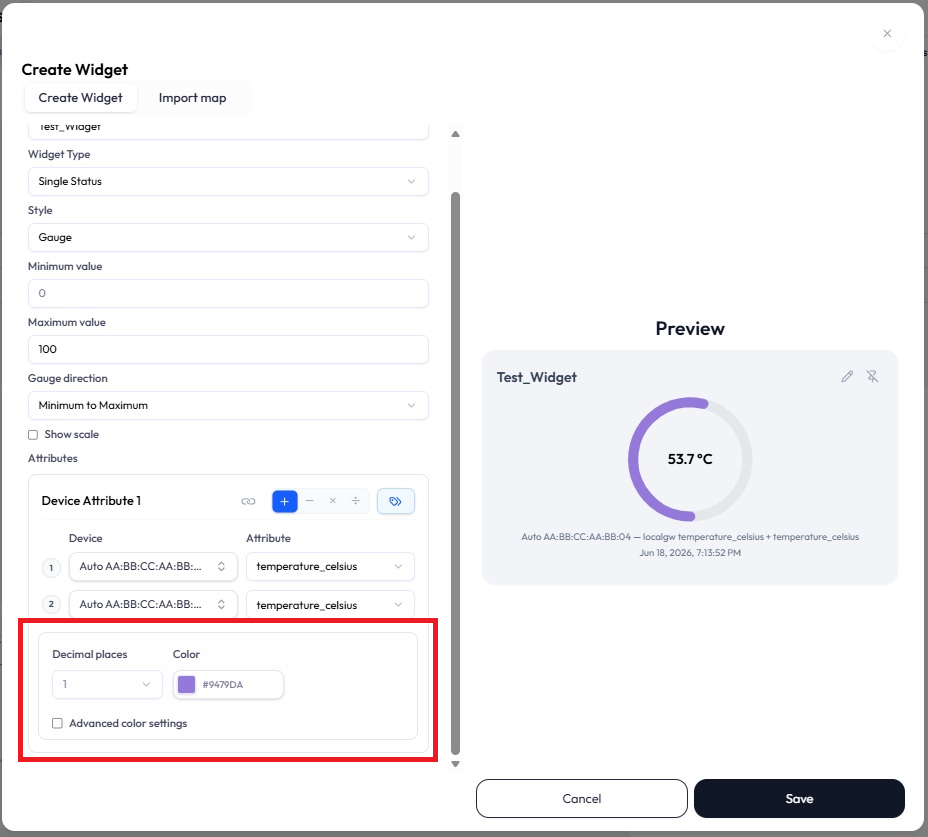
Style options (color, decimal places, and so on) work the same as for a single attribute. -
6Configure Strict Timestamp Mode. The chain-link button toggles Strict Timestamp Mode, which is ON by default. With it ON, the timestamps of the latest values of ① and ② must match for the result to be computed. With it OFF, each attribute’s own latest value is used regardless of timestamp.
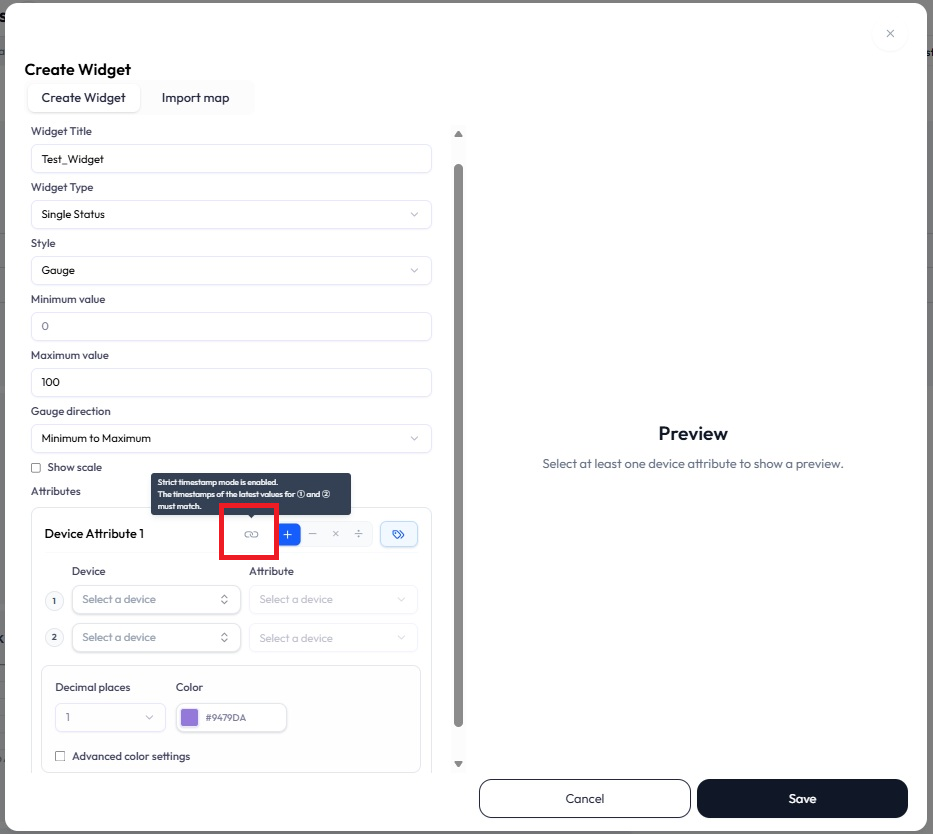
Strict Timestamp Mode (the chain-link button) is on by default, requiring ① and ② to share a timestamp. -
7Save and apply. Click Save, then return to the dashboard to confirm the calculated result is displayed on the widget.
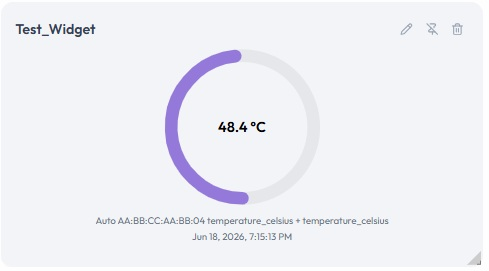
The saved widget shows the calculated value on the dashboard.
When the result can’t be calculated
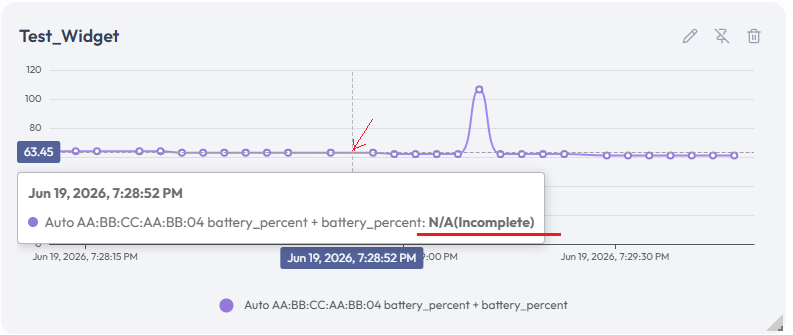
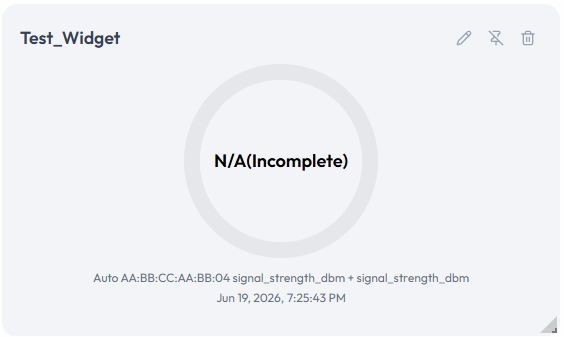
- Timestamps don’t match (or data is missing): with Strict Timestamp Mode ON, if the latest values of ① and ② do not share a timestamp, or either attribute has no data, the widget shows N/A(Incomplete).
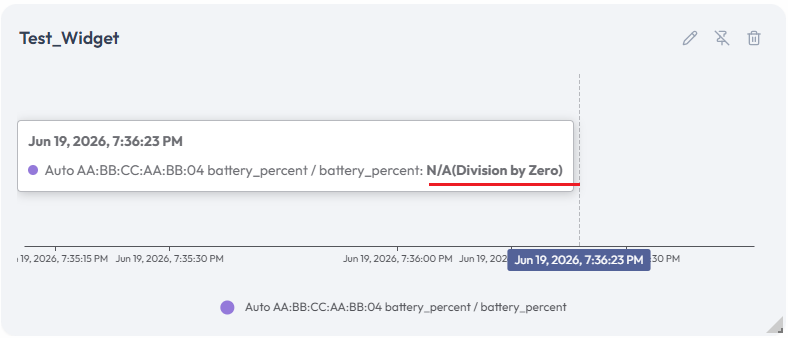
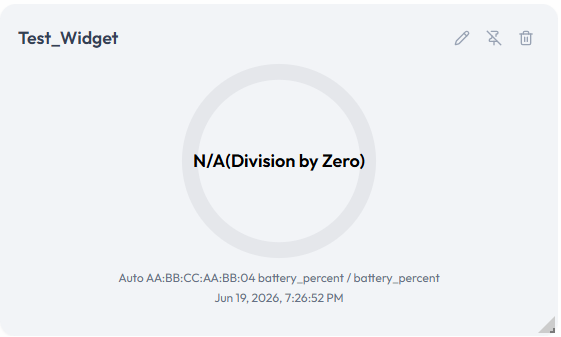
- Division by zero: when division (÷) is selected and the divisor is zero, the widget shows N/A(Division by Zero).
Multi Status Widget
Configuring a calculation on a Multi Status widget works the same way as on a Single Status widget — the difference is that a Multi Status widget has several Device Attribute sections, and each one can be set independently. You can put a calculation in some sections and leave others as plain single attributes, mixing calculated and non-calculated values in the same table or list.
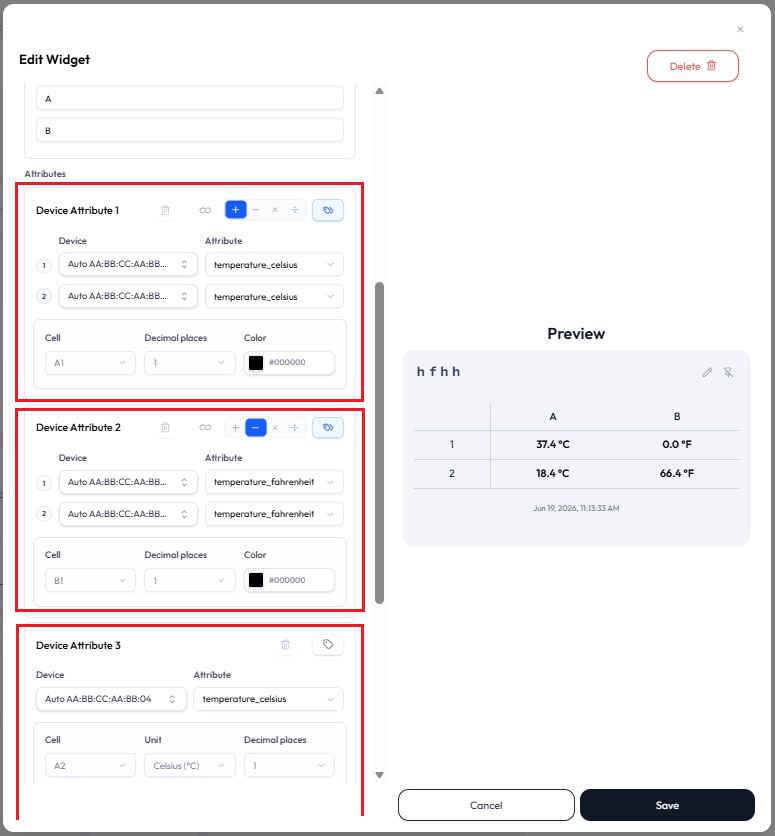
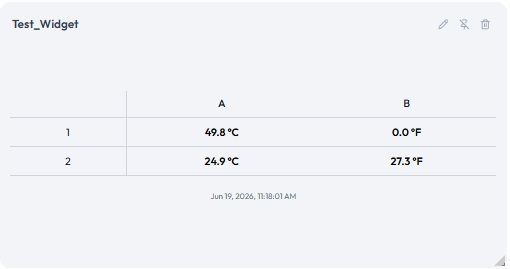
Chart Widget
On a Chart widget the calculation is plotted as a trend over time: the X-axis is the shared timeline of the two attributes and the Y-axis shows the calculated result. The flow is the same Multi Mode → operation → attributes pattern as above.
-
1Open the widget editor. From your dashboard, open the create or edit screen for the target Chart widget.
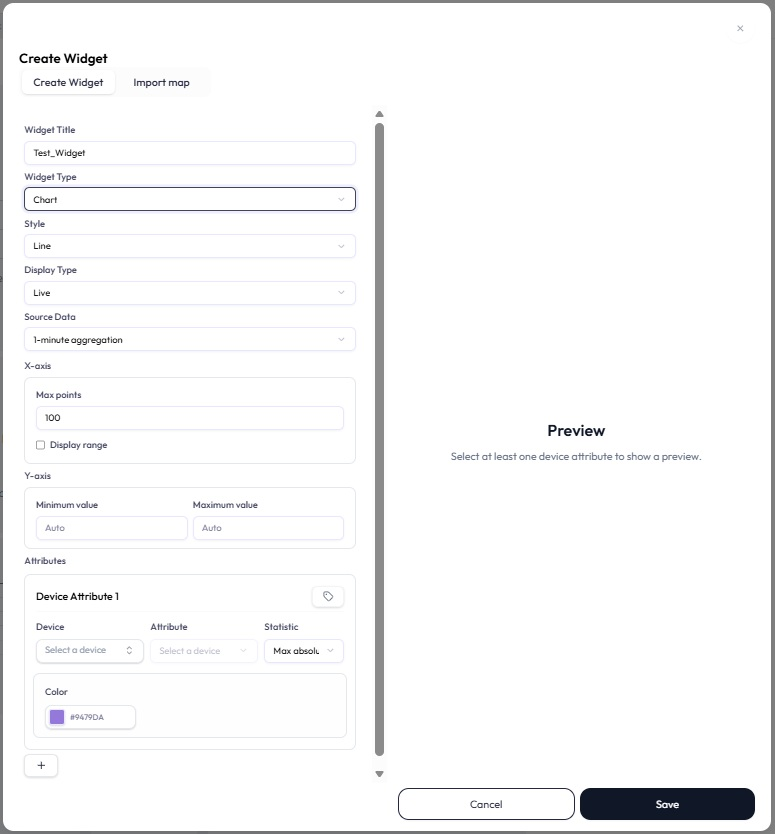
The Chart editor, opened in Single Mode with one Device Attribute row. -
2Switch to Multi Mode. In the Attributes section, click the Mode Switch button (the tag icon) to switch from Single Mode to Multi Mode. Clicking it again returns to Single Mode.
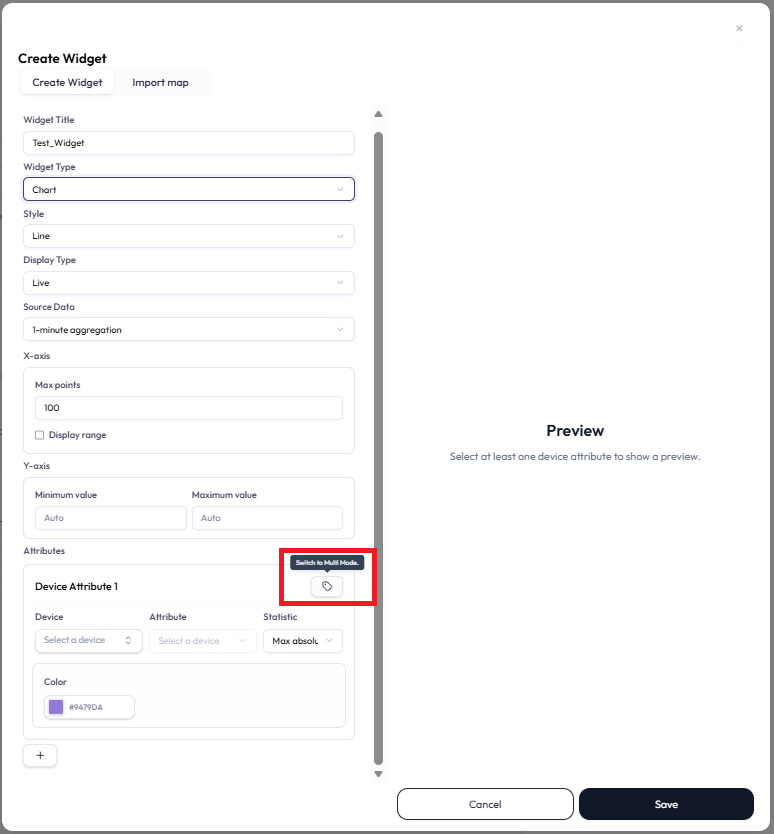
The Mode Switch (tag) button works the same on a Chart as on a status widget. -
3Select an operation type. In Multi Mode, the operation buttons appear next to the Mode Switch button — addition (+), subtraction (−), multiplication (×), or division (÷). Note there is no Strict Timestamp Mode button here, as explained above.
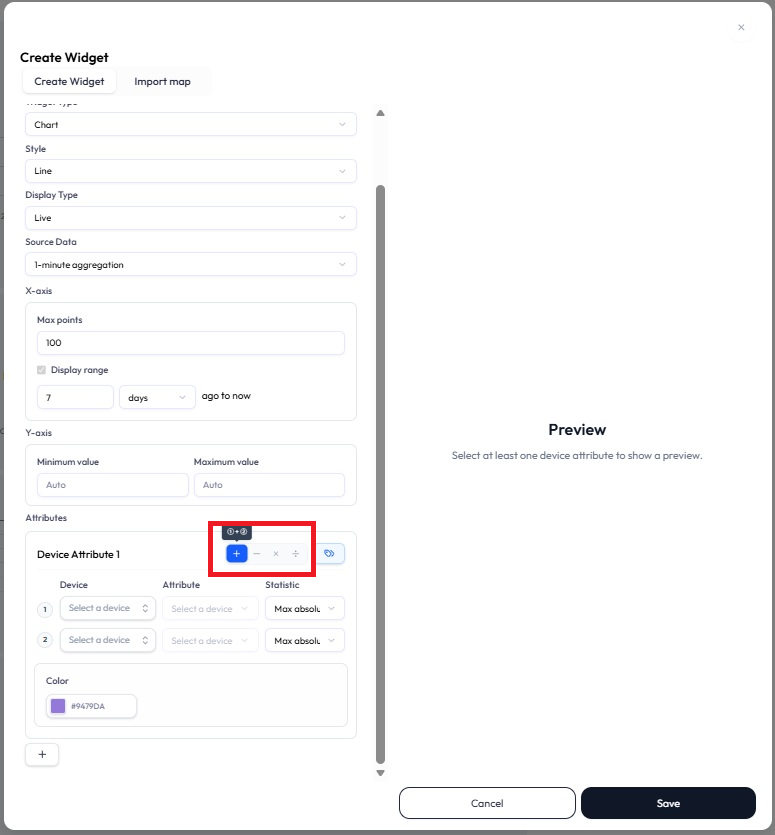
Pick the operation. A Chart shows no Strict Timestamp button — it is always strict. -
4Select the target attributes. Set the Device and Attribute for both ① and ②. The Preview plots the calculated series over the shared timeline.
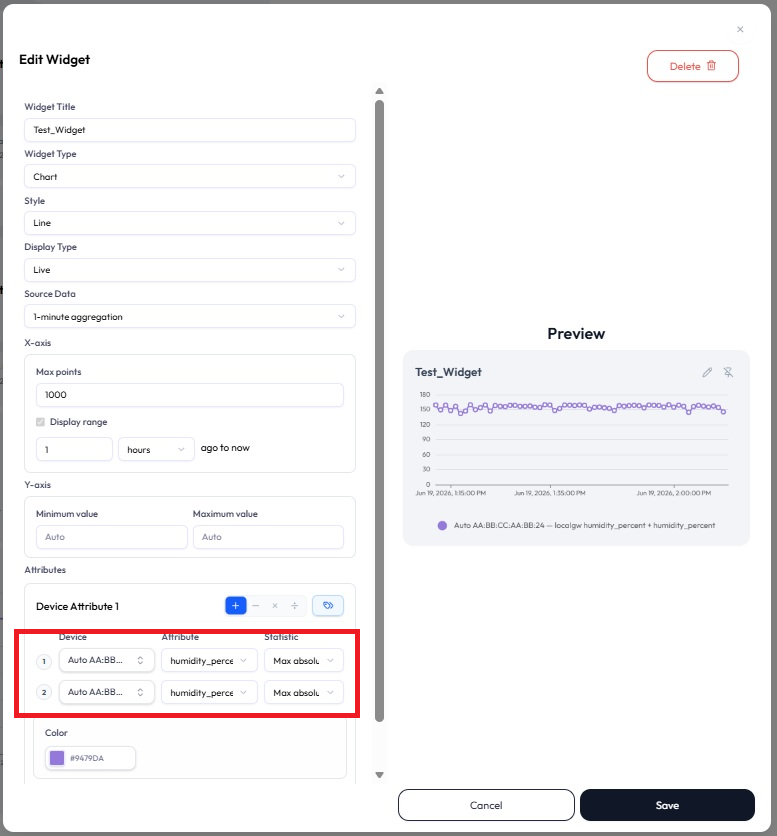
With ① and ② set, the Preview plots the calculated trend. -
5Configure optional settings. Set chart style options such as the Color as needed.
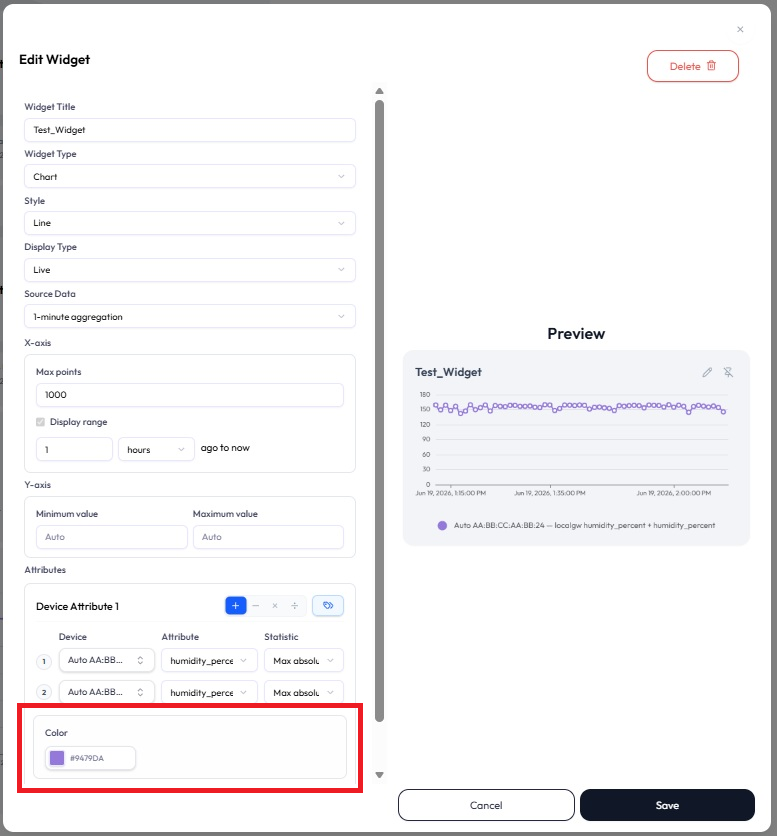
Chart style options (such as series color) apply as usual. -
6Save and apply. Click Save, then return to the dashboard to confirm the calculated trend is displayed on the widget.
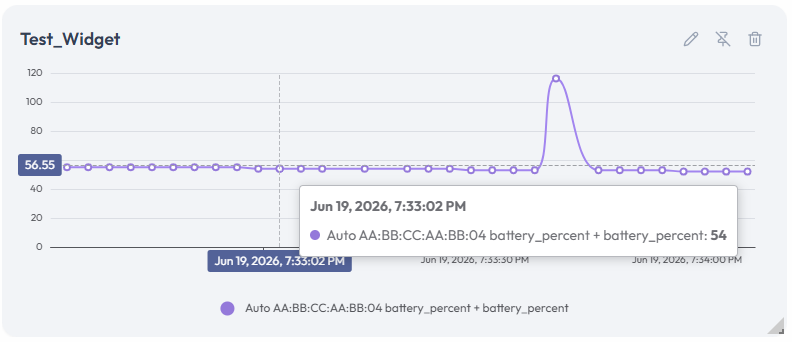
The saved Chart plots the calculated result over time.
When the result can’t be calculated
- Timestamps don’t match (or data is missing): because the chart is always strict, a point where ① and ② do not share a timestamp (or where data is missing) reads N/A(Incomplete).
- Division by zero: when division (÷) is selected and the divisor is zero, the point reads N/A(Division by Zero).