
Alerts
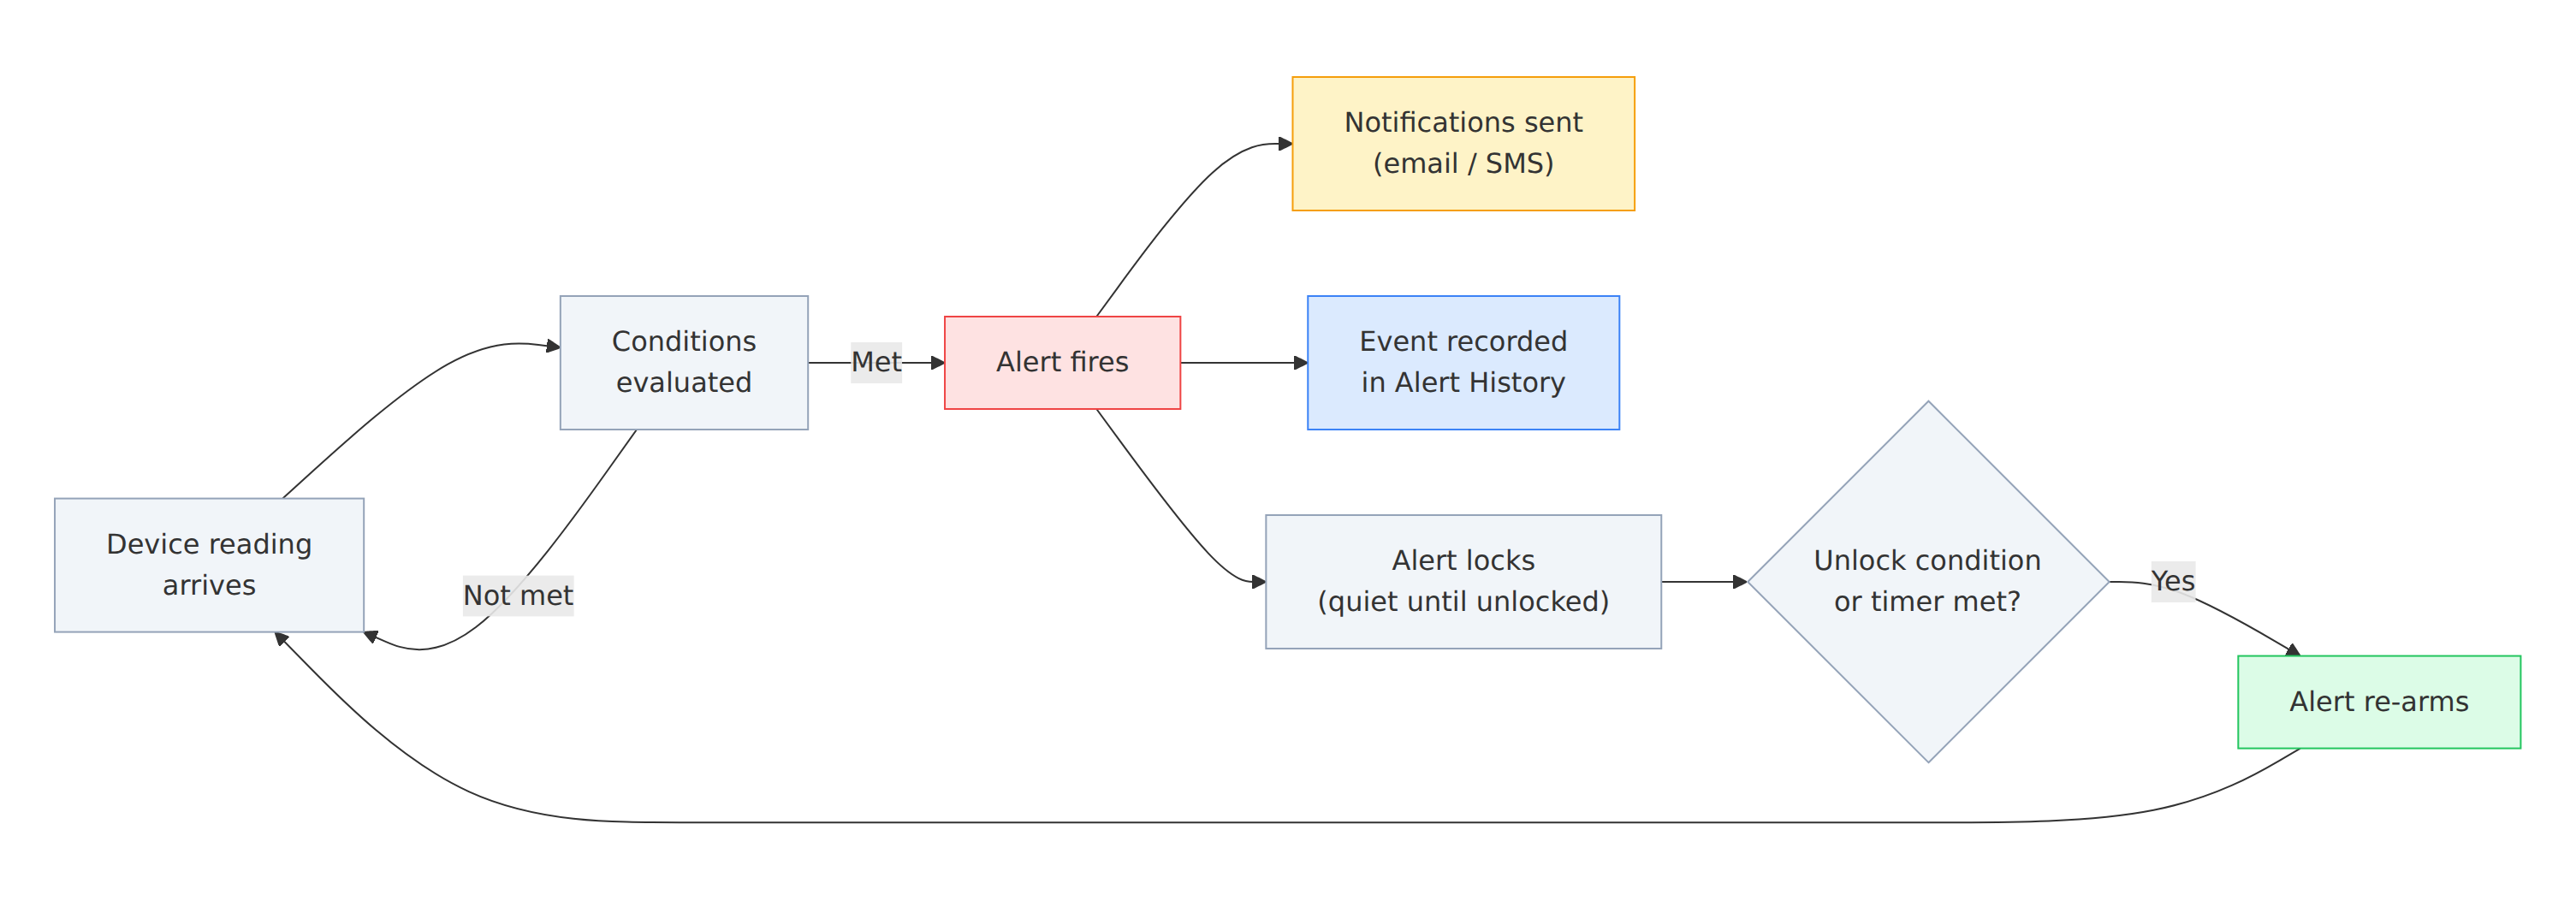
Alerts watch your device data and tell you when something needs attention. You define a condition, NEQTO.ai checks every reading against it, and when the condition is met it fires an alert and notifies the people you chose. Every alert that fires is recorded in Alert History so you can track and triage it.
The UI says Attribute and Endpoint; the API and support docs call these data type and data source. They are the same things, and this page uses the UI words.
Quick Start
If you already know NEQTO.ai, here is the short version.
-
1Open an application, go to Alerts, and click the + button to open the Set Alert dialog.
-
2Give the alert a title and a severity, then add a trigger condition: a device, one of its attributes, an operator, and a value. For example temperature Greater than 30.
-
3Leave Unlock by Timer on so one ongoing problem does not notify repeatedly. At the bottom, pick who to tell. Email and SMS both arrive switched on, so turn SMS off if this alert should only send mail.
-
4Click Create. The alert is checked against every reading from then on, and each time it fires the event appears in Alert History.
Alert Types
NEQTO.ai evaluates three kinds of alert. You build threshold alerts yourself in the Set Alert dialog. Connectivity and anomaly alerts are turned on per device — and, for anomalies, per sensor — from that device’s Connectivity Monitoring and Anomaly Detection Settings tabs. All three appear together in Alert History.
| Type | What it watches | How it triggers |
|---|---|---|
| Threshold | The current value of one or more device attributes. | Fires when your conditions are met, for example temperature Greater than 30. This is the default type in the Set Alert dialog. |
| Connectivity | Whether a device is still sending data. | Fires when a device goes silent past its timeout, and again when it comes back online. |
| Anomaly | One sensor reading versus its own physical limits and learned statistical range. | Fires when a value leaves the normal range. Configured per sensor on the device. |
An older kind of alert compared an attribute against its own recent history. The platform still understands those, but the Set Alert dialog now creates threshold alerts, and an old history alert opens as one.
Creating a Threshold Alert
Open Threshold Alerts and click the + button (its tooltip reads Create Alert) to open the Set Alert dialog. The dialog is organised as four tabs — Details, Conditions, Notifications and Payload Push — and the first of them opens with a Draft with AI field that can fill the whole form in for you.
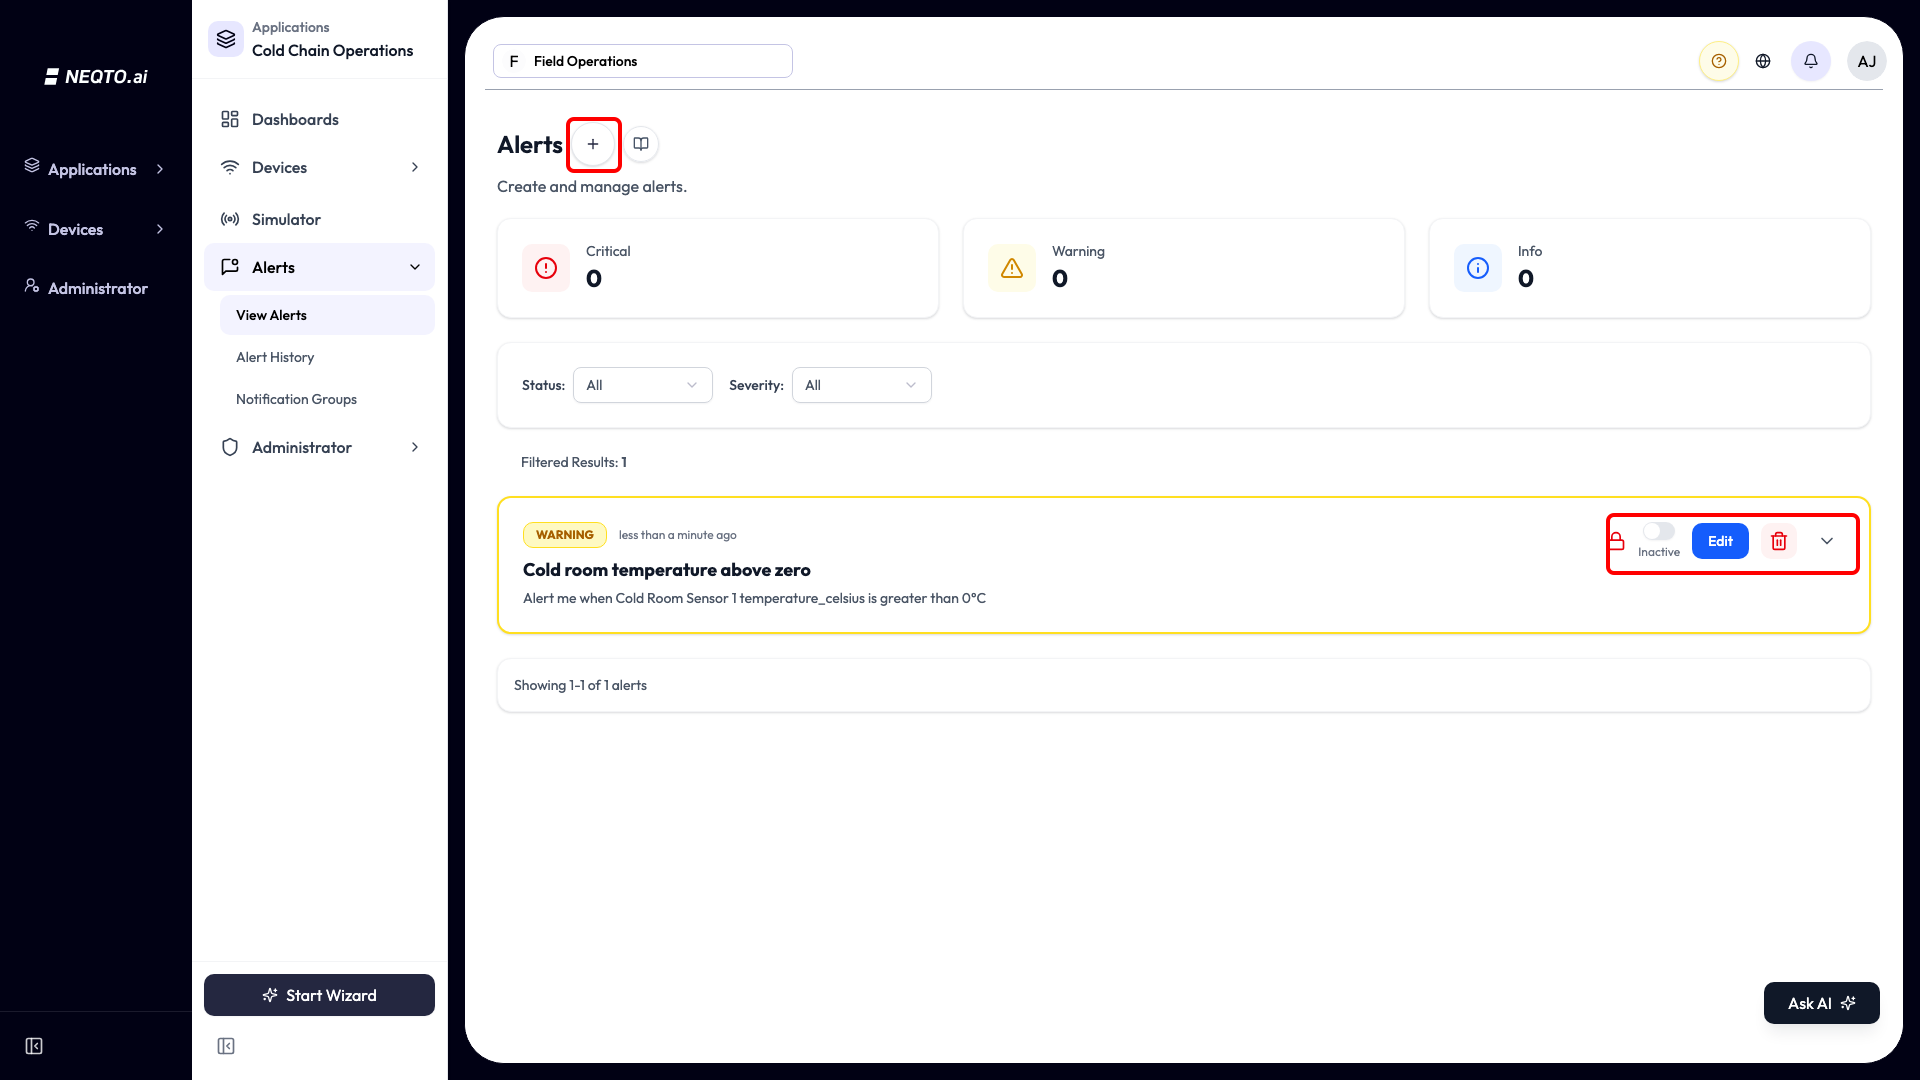
Each row shows a Status switch with an Active or Inactive badge, a Severity badge, a lock icon while the alert is locked (paused), the devices it covers and the attributes it watches. Edit and the delete button sit on the card itself, each shown only with the matching permission, and without edit permission the switch is replaced by the plain status. There is no “lock” action: locking comes from the alert’s unlock settings, below.
Filtering the list
Above the cards, Status (All, Active, Inactive) and Severity narrow the list, and the three summary cards also toggle a severity. Filtered Results gives the count.
When an alert’s device is deleted
Permanently deleting a device removes its trigger and unlock conditions. Alerts with remaining trigger conditions continue running. Those with none show Device unassigned and cannot fire. Hover the badge for what to do, then edit each alert to add a condition on an active device.
To move alerts to a replacement device before deleting the old one, follow the steps on the Endpoints & Devices page.
Moving between the tabs
Use Back and Next at the foot of the dialog to walk the tabs in order, or select a tab directly to jump to it. Nothing is lost either way: every tab stays filled in while you move around, and the alert is saved only when you save it.
On a narrow screen the tabs collapse to their icons alone, and the name shows as a tooltip. When something on a tab is incomplete or invalid, a small count appears on that tab’s label saying how many problems it has. This matters because a validation error on a tab you are not looking at would otherwise be invisible — if a save is refused, the counts tell you which tab to go back to.
Draft with AI
At the top of the Details tab is a field where you can describe the alert you want in plain language — something like tell me when the cold room goes above 8 degrees — and let the assistant fill the form in. It works when creating an alert and when editing one, where it asks instead what you would like to change.
The field needs Ask AI access in this application, and without it the field is hidden. Drafting also needs the permission to create alerts, or to edit them when the alert already exists. Without that, the field reads You don’t have permission to use this. It is not offered when the dialog was opened from the assistant.
When your plan uses AI credits, a line under the field gives the draft’s price and your balance, for example 5 credits · 120 of 500 credits available. Your message and each step the assistant takes are charged on top, as in chat. A draft that would use a large share of what is left asks first in a Confirm AI credit use dialog. When the balance cannot cover it, the field reads Not enough credits for this action. If AI is not part of your plan, the field says so instead, for example AI credits are not included in your plan.
Each field the assistant worked out for itself, rather than one you typed, is marked AI-inferred. Treat those badges as a checklist: they are exactly the values worth reading before you save.
| Status | What happened |
|---|---|
| Drafting | Your description is with the assistant. |
| Applied | The draft was applied and one or more fields were filled in. |
| No changes | The assistant had nothing new to add. Usually this means the form already says what you asked for. |
| Question | The assistant needs something from you before it can draft, and has asked in Ask AI. Answer it there and the draft continues. |
The Details tab
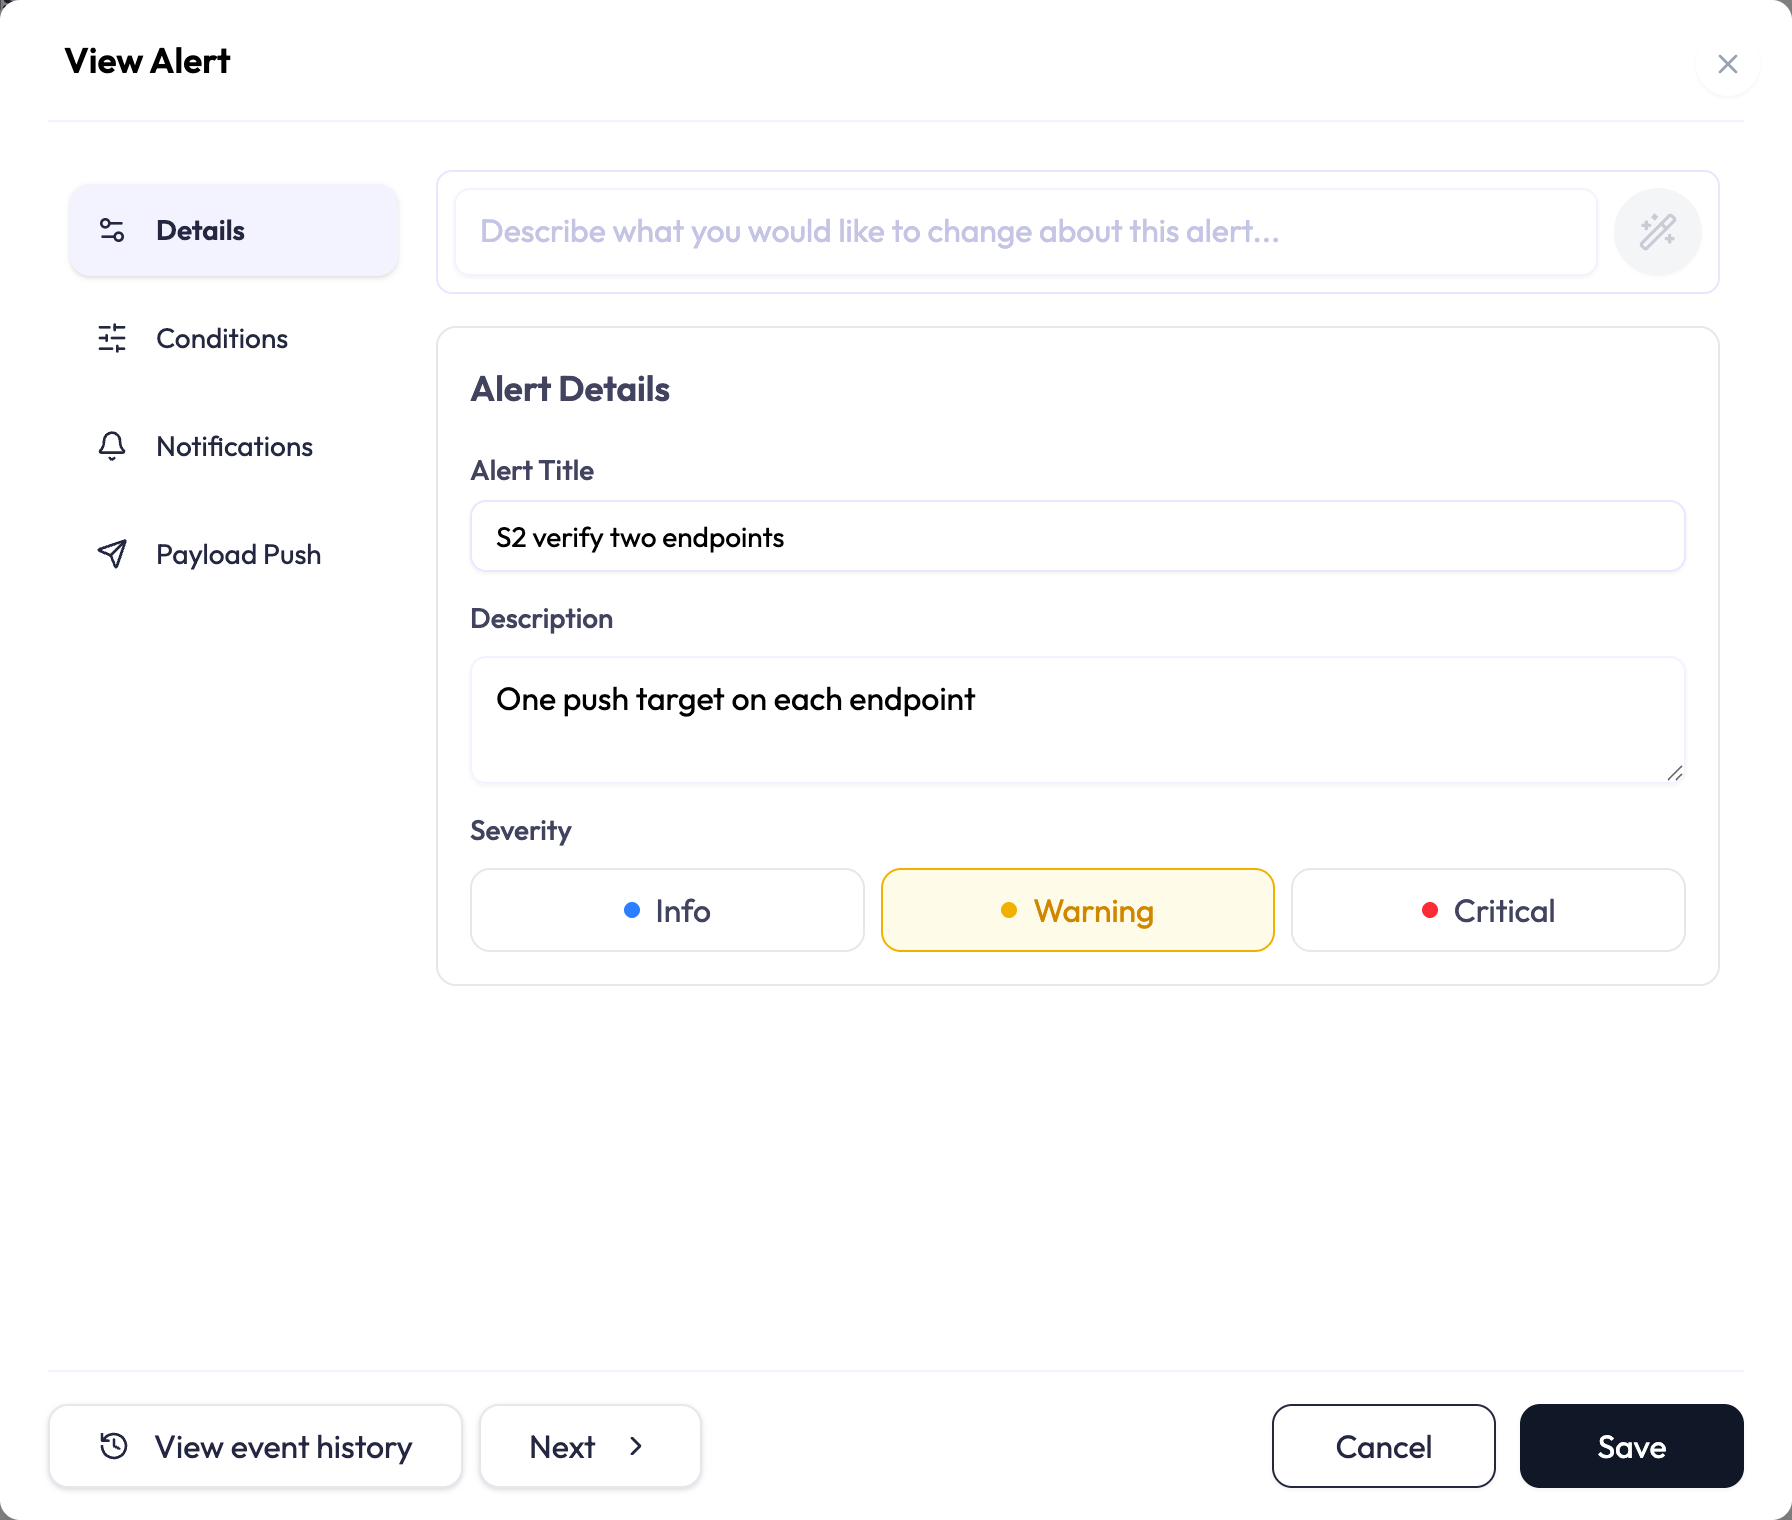
What this alert is called, what it is for, and how loudly it should read.
-
1Enter an Alert Title (required, up to 100 characters; letters, numbers, spaces, and the basic punctuation
- _ ( ) , . :are allowed). -
2Optionally add a Description saying what this alert watches and why. It is free text, and it is worth writing: it is what the next person sees when they are deciding whether an alert still earns its place.
-
3Pick a Severity. The control is a row of three buttons — Info (blue), Warning (yellow, the default) and Critical (red) — and exactly one is selected. Severity is a label for triage and filtering; it does not change when the alert fires.
The Conditions tab
A condition is one row: a device, one of its attributes, an operator, and a value. Add up to 10 conditions.
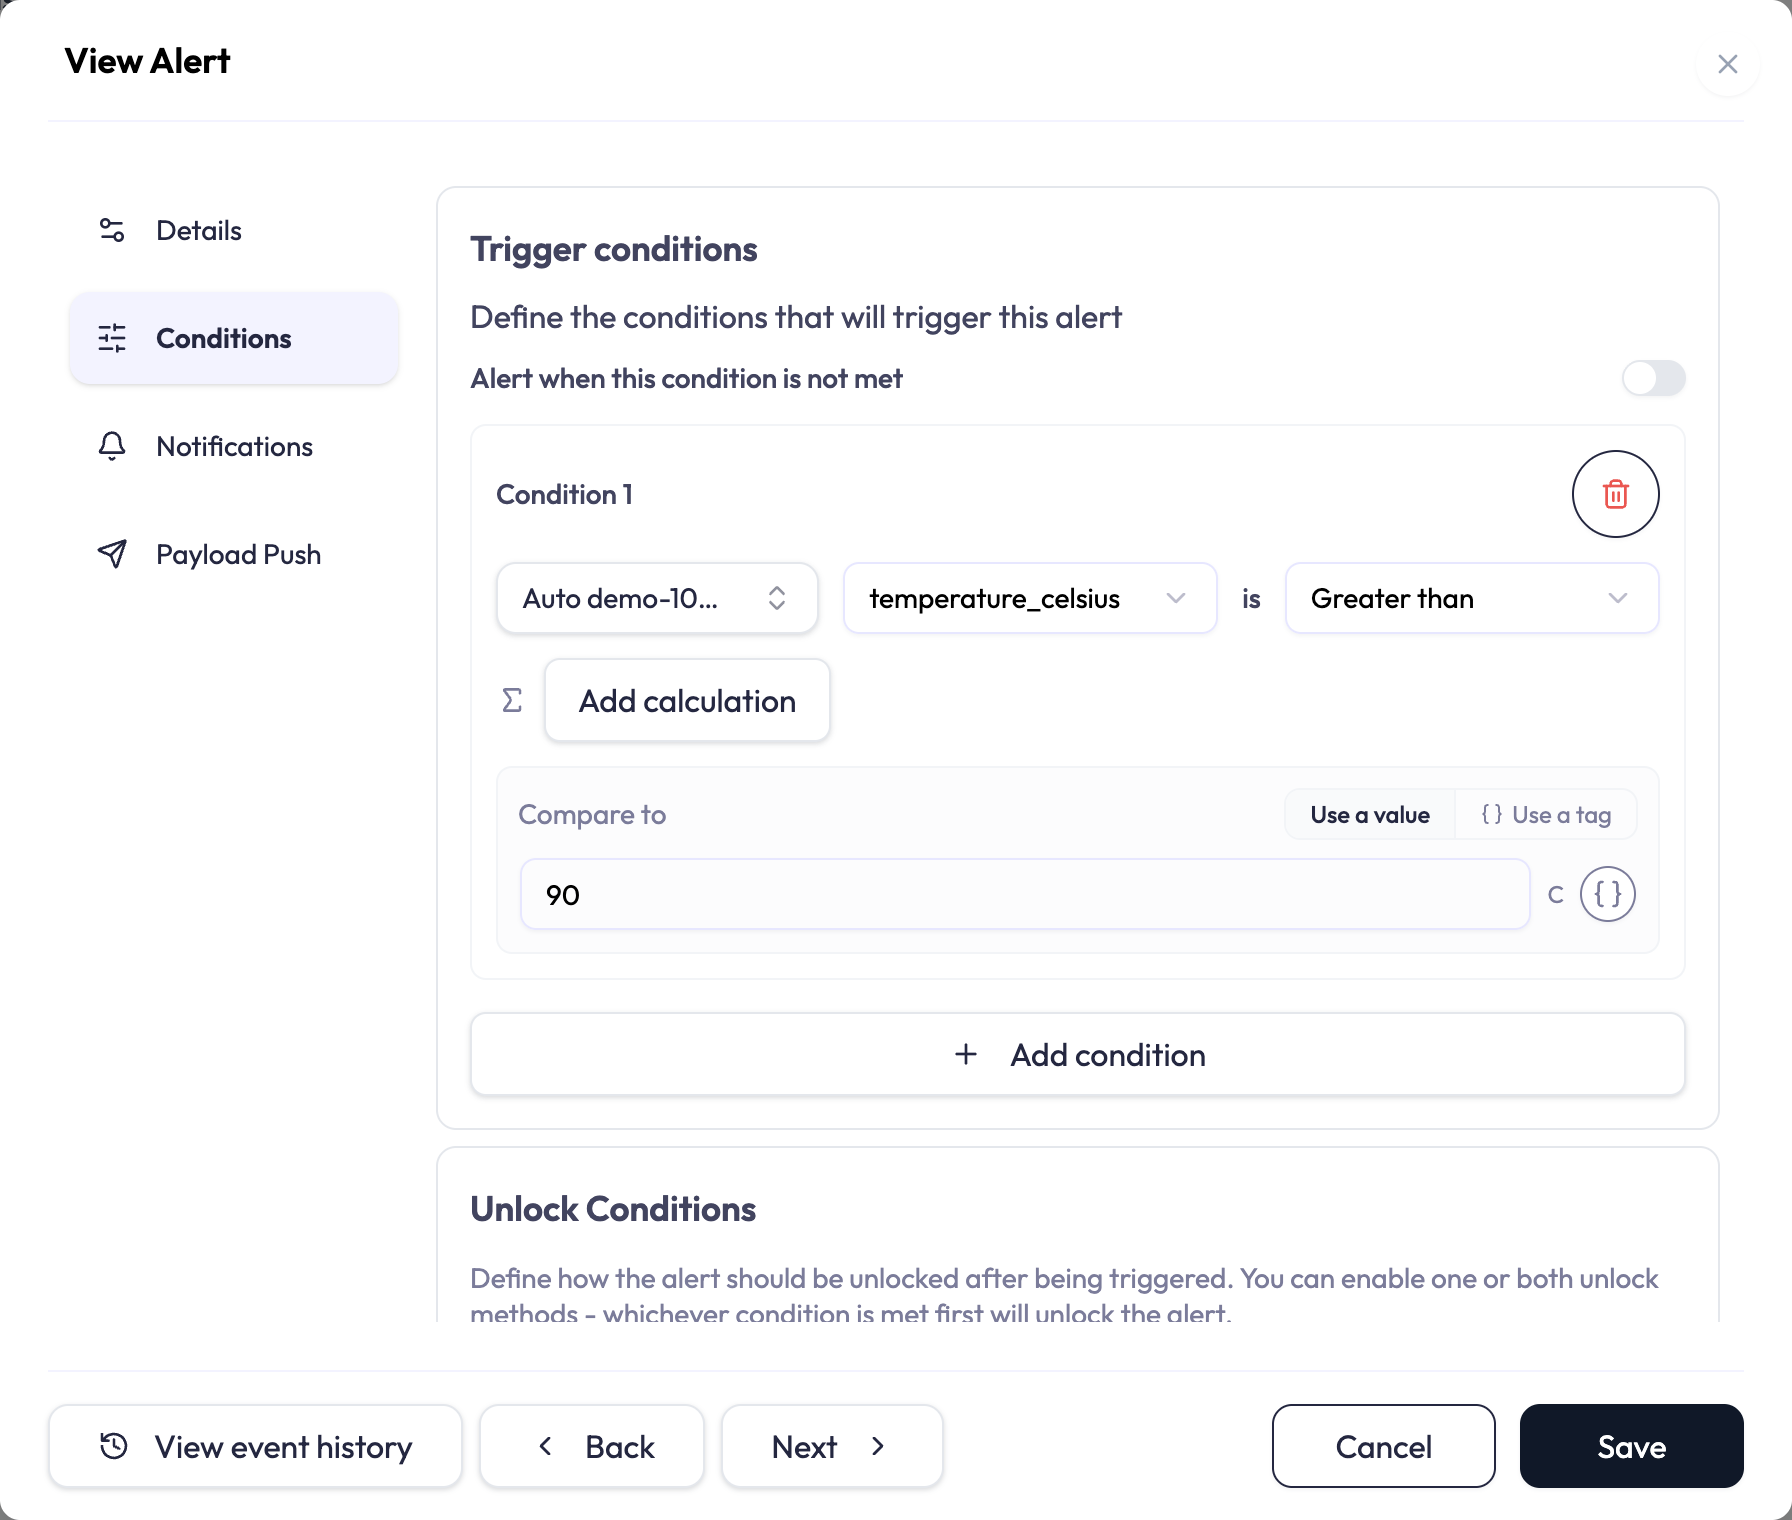
The available operators depend on the attribute’s data type:
| For numbers | For text |
|---|---|
Greater than (greater) |
Contains (contains) |
Greater than or equal to (greater_equal) |
Exact match (exact_match) |
Less than (less) |
Does not match (no_match) |
Less than or equal to (less_equal) |
|
Equal to (equal) |
|
Not equal to (not_equal) |
What the dialog offers for combining conditions depends on how many you have added. With two or more, a Condition logic control appears: AND (All) fires only when every condition is true at once, OR (Any) when at least one is, and NOR (None) only when none are. With exactly one condition there is nothing to combine, so you get a switch instead, Alert when this condition is not met. Turn it on and the alert fires when the condition is false. Either way, conditions are re-checked as each device’s readings arrive.
Each condition’s value field has a Compare to switch. Use a value, the default, compares against a fixed number — or a keyword, on a text attribute. Use a tag compares against one of your tags instead: click the braces icon, search, and pick one. Point several alerts at the same tag and a shared limit changes in one place instead of in every alert.
The picker only offers tags whose value type fits the attribute, and greys out the rest. Once you pick one, a preview shows what it resolves to right now, for example Resolves to 30. If the tag is later deleted, or stops fitting, the field flags it and blocks Save.
A condition can compare the result of a calculation instead of the number the device sent — a short formula built from that device’s own attributes and, if you like, your numeric tags, re-run on every reading. A sensor sending Fahrenheit can be watched in Celsius. Once a row names both a device and an attribute, a Σ marker and an Add calculation button appear beside it, and only numeric attributes accept one.
Writing the formula, what it changes about the condition, and what clears it are the same wherever this appears, so they are documented once under Calculated Conditions below.
current_channel_1, current_channel_2, current_channel_3.
If you ask the assistant to watch “current channel”, it does not guess which one you
meant: it creates one numbered condition per channel, so Condition 1 through
Condition 3 cover all of them.
Two rules keep that from over-reaching. A family needs at least two members sharing a trailing
number, so temperature_celsius and temperature_fahrenheit are never
treated as channels of one thing. And a name that matches two families expands to neither,
because the assistant cannot tell which you meant. If fanning out would push the alert past the
limit of 10 conditions, nothing is expanded at all — you are told rather than handed a
rule that silently watches only the first few channels. You can combine a channel family with
another condition using OR, so any of those conditions can fire the alert. If you ask to combine
a family with another condition using AND or NOR, the assistant asks you to clarify because the
alert cannot group the channels separately. A family on its own defaults to OR; if you
explicitly choose AND or NOR, the assistant keeps your choice.
Unlock conditions
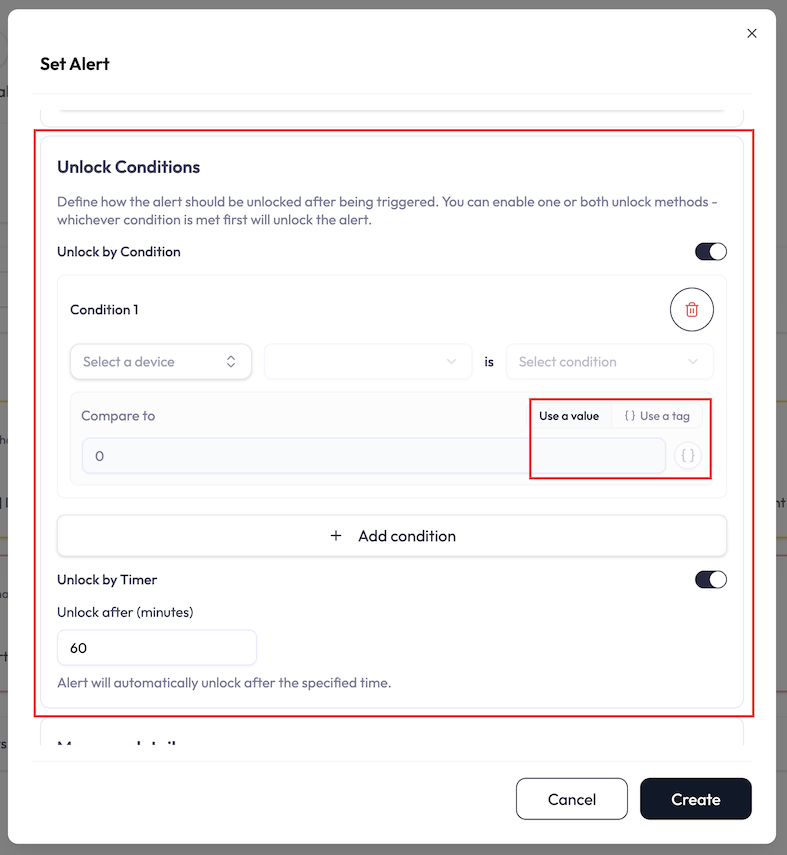
Unlock conditions sit on the Conditions tab, below the trigger conditions. They control how an alert re-arms after it fires. With either method on, the alert fires once, then locks and goes quiet until it is allowed to re-arm. So a timer’s length is the minimum gap between notifications about the same problem. Unlock by Timer is on by default at 60 minutes. Turn both methods off and the alert stays locked until you re-enable it by hand.
| Method | What it does |
|---|---|
| Unlock by Condition | Re-arms when a condition you define becomes true. These rows work exactly like trigger conditions (same device, attribute, operator, and value, up to 10), including the option to compare against a tag. Use the opposite of your trigger, for example trigger when temperature is above 30, unlock when it drops below 25. |
| Unlock by Timer | Re-arms automatically after a set number of minutes (minimum 1, the field defaults to 60). The countdown starts when the alert locks. |
The Notifications tab
The Notifications tab offers two delivery channels: email and SMS. Slack and PagerDuty are not channel options in this tab. Choose who to tell in the recipient list below. Email notifications and SMS notifications are independent and both are on by default, and they use the same recipient list. Turn off either channel if you do not want to use it.
Email and SMS alerts depend on your plan. An excluded channel is off and greyed out, with Email alerts aren’t included in your plan. or SMS alerts aren’t included in your plan. in place of its description. If you can open the Billing tab, a View plans link follows it. The matching switches on external contacts are greyed out too. See Administration.
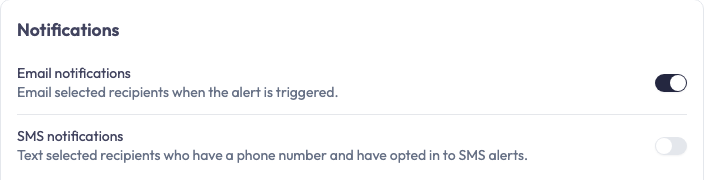
A Notification Recipients block appears as soon as either switch is on. Turn both off and the individual users you picked are cleared, though external contacts and groups are left alone.
For an account user, turning SMS notifications on is only half of it. They also need a phone number on their profile and the SMS opt-in switched on there, and a user with neither is skipped quietly, by design. External contacts work the other way round: you set their email and SMS preferences yourself when you add them.
Payload push does not depend on either switch. An alert with both switches off still sends its payload when the target’s Action is Enabled or Sending unapproved. A failed push cannot cost anyone their email or text either: each destination records its own outcome, and none of them stops a notification going out.
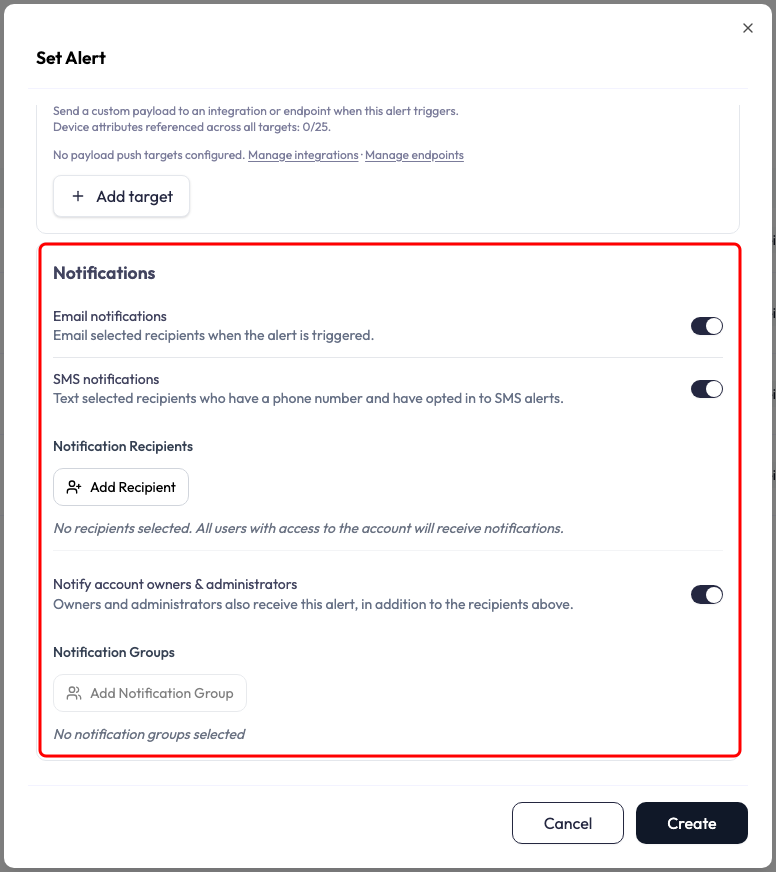
Three kinds of recipient go into that one list:
- Users from your account or application, added with Add Recipient → Add User. Each is reached on the channels you switched on, as far as their own profile allows.
-
External contacts, added with Add Recipient → Add External.
Give an email address and/or a phone number, and toggle Email and SMS per contact. Phone
numbers use E.164 format, for example
+1234567890. - Notification Groups, reusable recipient lists (see below).
Notify account owners & administrators sits below the recipients and is on by default, adding the account’s owners and administrators to whoever you picked. It only matters once at least one individual user is picked: with none, everyone is notified regardless.
Every alert that fires is written to Alert History whichever channels are on, so there is nothing to switch on for in-app activity.
Message details
Below the notification channels, on the same tab, Message details adds context to the message those channels send. Everything here is off by default.
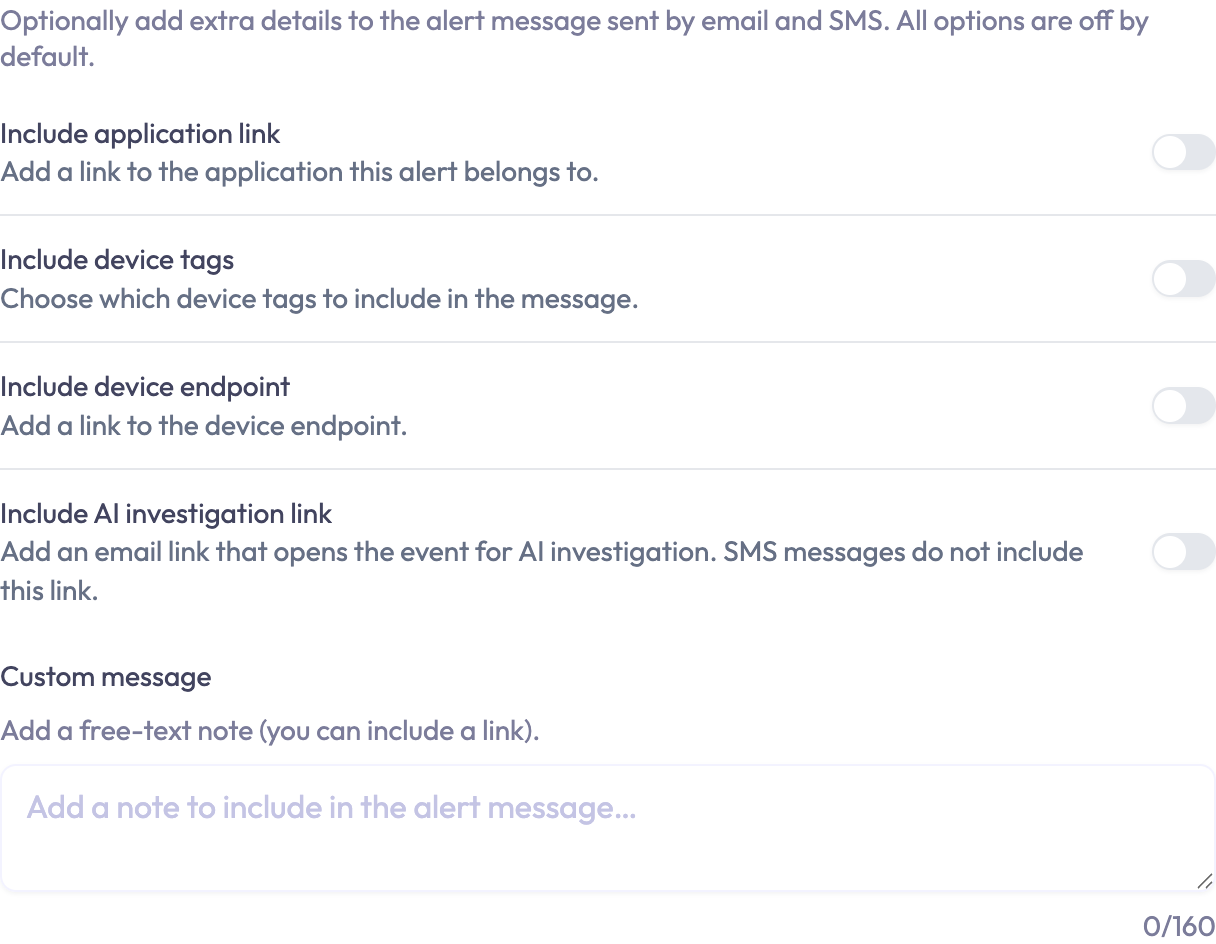
- Include application link — adds a link back to the application the alert belongs to.
- Include device tags — turning this on reveals a picker so you choose which of the device’s tags to include in the message.
- Include device endpoint — adds a link to the device’s endpoint.
- Include AI investigation link — adds a link to the notification email that opens the event ready for an AI investigation, so whoever reads the alert can start looking into it in one click. SMS messages do not carry the link, because a text has nowhere useful to put it.
- Custom message — a free-text note (up to 160 characters) added to the alert message.
The Payload Push tab
Email and SMS tell a person that something happened. Payload push tells a machine. When the alert fires it also sends a message of your own design to an integration or a device endpoint, independently of the notification channels on the previous tab.
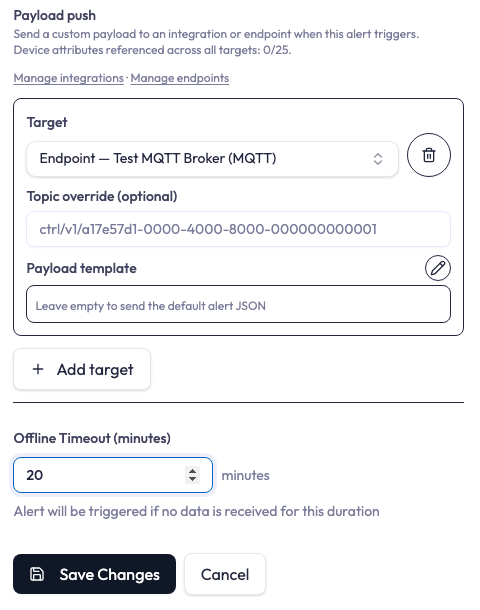
The section starts empty, reading “No payload push targets configured.” Click Add target, pick a destination, and optionally write a payload template. An alert may have up to five targets, and Add target greys out at five.
That is all of it inside this dialog. Destinations, templates, tokens, what blocks a save, and what each delivery outcome means are the same wherever payload push appears, so they are documented once under Payload Push below.
Saving the alert
Click Create to save. Editing an existing alert opens the same dialog (titled View Alert) with a Save button. If a save is refused, check the error counts on the tab labels to find what is missing.
When you open an alert that already exists, and you have permission to view alerts, a View event history button sits in the bottom-left of the dialog. It is not offered when the editor is opened from the assistant. It opens Alert History filtered to that one alert, so you can see what this rule has actually been doing before you change it. Opening it does not start an AI investigation.
Calculated Conditions
A calculation lets an alert watch something the device never reports. A device sending a supply and a return temperature can be watched on the gap between them, and one sending Fahrenheit can be watched in Celsius. Nothing changes on the device; the alert does the arithmetic.
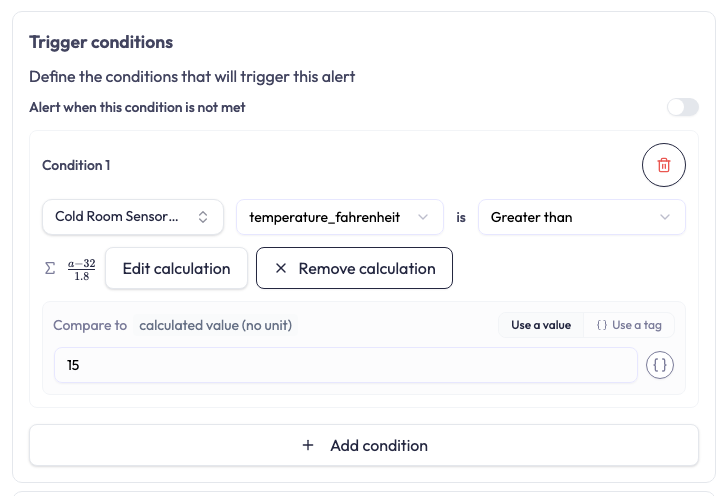
Adding a calculation
-
1Add calculation opens the editor with an empty formula and one variable already bound:
a, the attribute the condition watches. It cannot be removed, because a formula ignoring it would be comparing something else. Writing the formula is still yours to do — insertafrom its card, or type it — and Save stays greyed out until you do. -
2Edit calculation reopens the saved formula, though you rarely need it just to read one: the formula is written out on the row.
-
3Remove calculation deletes the formula and returns the condition to the raw reading. Closing the editor with Cancel is not the same thing; that changes nothing.
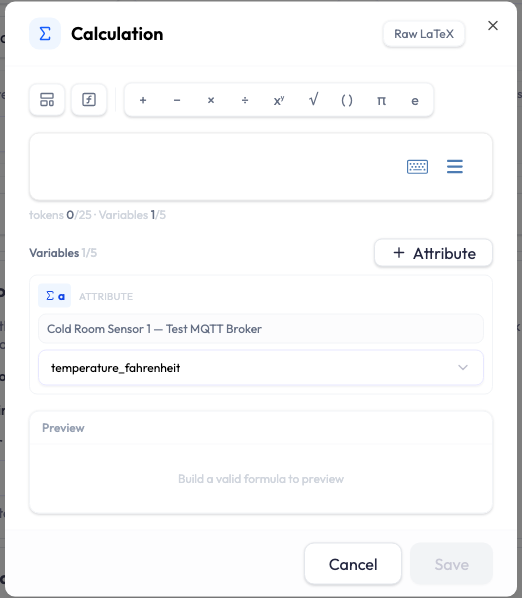
a is already bound, but the formula box is
empty — so Save is disabled until you write one.
How the alert editor differs
This is the same editor the dashboard widgets use. Widget Calculations documents it in full — the toolbar, the templates, the functions, and how the limits are counted — so read that page for the editor itself. Four things differ when you open it from an alert:
- Every attribute variable comes from this condition’s device. There is no device picker, because an alert judges one device’s reading rather than a chart’s worth of data. A tag variable is the exception; see below.
- The limits are much smaller: 5 variables, 25 building blocks, 8 levels of nesting and 4,096 characters, against a widget’s 20, 50, 12 and 32,768. An alert formula runs on every incoming reading rather than once when a chart is drawn. The counters show the alert’s limits, and the button that would add a sixth variable is greyed out.
- The preview is a single number, not a chart — the alert has no time range to draw, only the reading that just arrived.
- The result has no unit, since a formula’s output is no longer in the attribute’s unit.
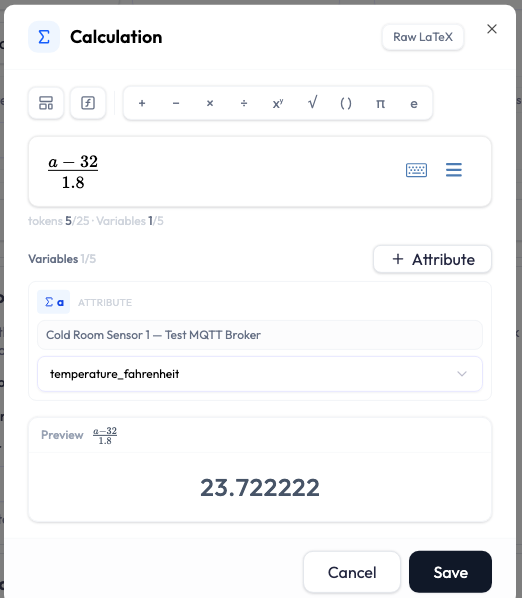
The preview has three states, and they differ in whether you can save. An unfinished formula blocks Save; readings that have not arrived do not.
| What you see | What it means |
|---|---|
| Build a valid formula to preview | The formula is not finished — an empty box, or a variable with nothing chosen. Save is disabled while this shows, including when the editor has just opened. |
| Latest values unavailable | The formula is fine, but the device has not reported recently enough to compute it. The condition is still valid and can be saved. |
| A number | What this condition would compare right now. Shown without a unit. |
Tags in a calculation
Under Variables, Tag adds one of your tags beside the attributes, so a formula can read a value you keep in one place, such as a calibration offset subtracted from the reading. The button appears only with permission to view tags. Only numeric tags (INT or FLOAT) can be picked; the rest are greyed out with Only numeric (INT or FLOAT) tags can be used. The formula must still use the condition’s own attribute.
- A tag has one value for the whole alert. The picker offers the account’s tags and this application’s tags. The tag does not need to be assigned to the device.
- Changing the tag’s value takes effect without a new reading. About every 30 seconds NEQTO.ai re-checks enabled alerts whose trigger formula reads a tag edited since the alert was last saved, using each device’s latest reading. A locked alert waits for its unlock as usual.
- A formula with no answer is not read as false. If a reading lacks one of the formula’s attributes, that condition keeps its previous state. If a tag gives no usable number, the whole alert holds, so nothing fires or clears on that pass.
A tag that an alert calculation reads cannot be deleted or changed to a non-numeric type. The request is refused and names the reason. Take the tag out of every alert formula first, including on alerts that are switched off.
What changes on the condition
Only the six numeric operators are offered, because a formula’s result is a number. A chip appears beside Compare to reading formula result, and the attribute’s own unit disappears, as a reminder that your number is matched against the formula’s result rather than against the raw reading. Where the calculation declares an output unit the chip names it instead, as formula result: <unit>. Both Use a value and Use a tag still work.
The sentence the alert writes about itself gains the word (calculated) — “Alert me when Boiler room temperature (calculated) is greater than 100” — so nobody goes looking for a reading of 100 the device never sent.
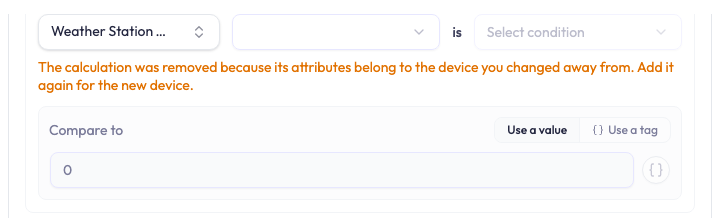
Rarely, a saved calculation cannot be read, which means this version of the app does not understand the stored formula. The row says so and offers Remove calculation but not Edit. Remove it and add the formula again.
A fired calculated condition records what the formula produced alongside what the device sent. See Alert History below.
Payload Push
Payload push sends a message of your own to another system when an alert fires. It appears in three places — the Set Alert dialog, a device’s Connectivity Monitoring card, and each anomaly sensor row — and the rules below are the same in all three. Only the alert tokens available to you differ, because they describe whatever fired.
Choosing a destination
To trigger a webhook when an alert fires, use Payload Push with a Custom HTTPS integration. Set it up in this order:
- Create the Custom HTTPS integration. Set its direction to Push or Pull & Push and its Push URL to the webhook URL.
- In the alert’s Payload Push tab, add that integration as a target. Use the default alert JSON or a payload template that matches the receiving service, then save the alert. Adding this alert target creates its Action; creating the integration alone does not.
- Open Actions and select Dry run for that alert target. Review the destination and payload, then select Approve inside the Dry run dialog. Back in the Actions list, select Enable. In the UI, Dry run is how you reach Approve; it is not an optional step. A new target cannot send before approval and enabling.
When the alert fires, NEQTO.ai sends a JSON POST using the integration’s saved
authentication and headers. An HTTPS device endpoint cannot receive these pushes;
choose an HTTPS integration instead.
There are two kinds of destination:
- An integration is a connection to an outside service. Use it to hand the event to software living outside NEQTO.ai.
- A device endpoint is the doorway your own equipment talks through, so pushing there sends a message back down to your devices. This is how an alert makes something happen in the physical world rather than only telling somebody about it.
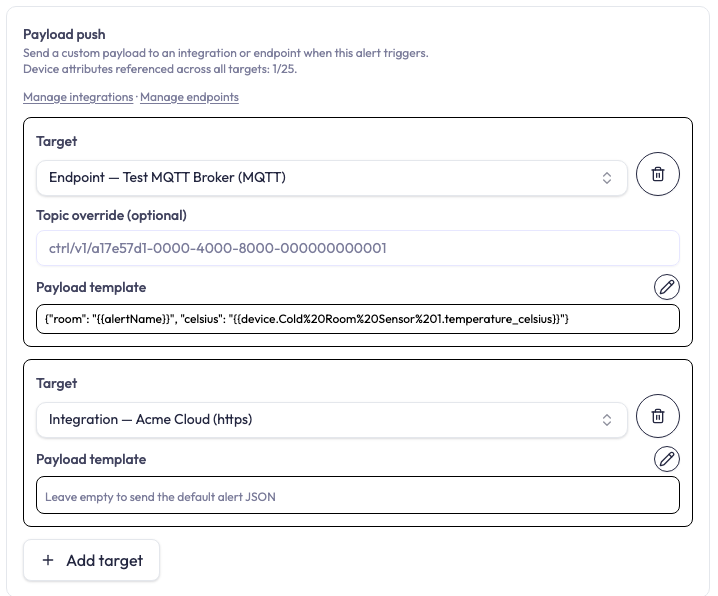
The picker lists each destination with its kind and protocol, for example Endpoint — Test MQTT Broker (MQTT). Not everything you own appears: an integration has to be set up to send data out, and an endpoint has to be one the platform can push down. HTTP and HTTPS endpoints cannot receive a payload push at all. Manage integrations and Manage endpoints links open the pages where those are set up. A destination that stops being usable is not dropped — it stays in the list with — no longer available added to its name.
MQTT delivers to a named topic, the address the receiving side listens on. A
Topic override (optional) field lets this alert publish somewhere other than
the destination’s usual topic. It appears only where a topic exists to override — an integration
speaking MQTTS, or an endpoint of type MQTT — so its absence elsewhere is not a fault. Topics
may be 256 characters, and # and + are refused with
“Topics must not contain # or + wildcards”: they mean “match anything” when listening,
and nothing when sending.
ctrl/v1/ followed by that endpoint’s identifier, or match a topic
template already configured for it. The greyed-out text in the field shows exactly that prefix.
Nothing in the browser checks it as you type. So a topic outside the area is accepted by the
field, then refused when you save the whole alert, with “Payload push target is not usable:
Topic is outside the endpoint’s allowed namespace”. If a save fails on a field that looked
fine, this is usually why.
The payload template
The template is the text of the message. Leave it blank and NEQTO.ai sends its own default description of the alert as JSON, which is enough for many receivers. Write one and you control the shape exactly, which matters because the system at the other end usually insists on a particular shape.
Each destination row shows the first two lines of its template. Click the pencil, or the preview itself, to open Edit payload template. A template may be up to 4,096 characters, and a counter beside the box keeps score.
{"name": "{{deviceName}}"} and not {"name": {{deviceName}}}. The
replacement is pure text, so an unquoted token produces something that is no longer valid JSON.
NEQTO.ai only judges a template as JSON when it starts with [, or with a
{ that is not the beginning of a token. A template opening with a token, like
{{device.Boiler.temp}} ppm, is treated as ordinary text and never JSON-checked.
Tokens
A token is a placeholder replaced with a real value when the alert fires.
{{deviceName}} becomes the device’s name. There are three families:
| Family | Looks like | What it gives you |
|---|---|---|
| Alert tokens | {{alertName}}, {{value}}, {{threshold}} |
Facts about the alert that is firing — its name and severity, the device and measurement that tripped it, the value and the limit, the time. The editor lists the ones this alert type offers underneath the text box. |
| Tag tokens | {{tag.location}} |
The current value of one of your tags. |
| Device tokens | {{device.Cold%20Room%20Sensor%201.temperature_celsius}} |
The latest reading of a named device’s measurement — and it need not be the device that fired, so one alert can carry the state of several sensors at once. |
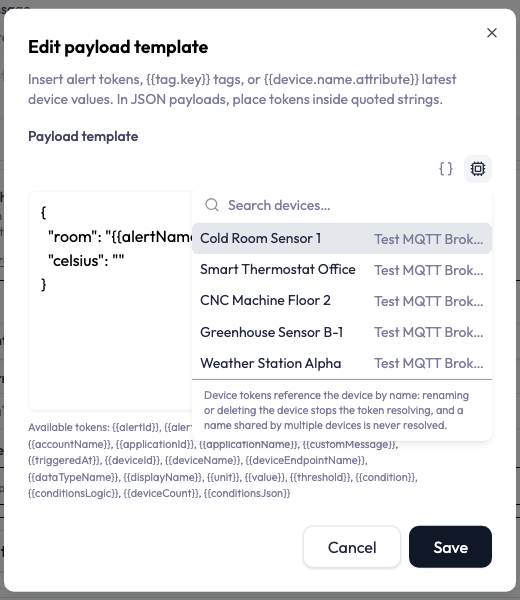
Two buttons above the text box insert tokens for you: one searches your tags, the other your
devices and then that device’s measurements. Use them rather than typing. A
device name inside a token is escaped, so a space becomes %20 and
Cold Room Sensor 1 has to be written Cold%20Room%20Sensor%201. Most real
device names cannot be typed literally at all.
{{device.OldName.temperature_celsius}} where a number should be, and the push is
still recorded as queued. That is deliberate: a device briefly late reporting
should not drop the whole message. Check the templates that mention a device when you rename
it.
One alert may reference 25 device measurements. The count is of distinct measurements across every destination, so naming the same one in three templates costs one rather than three. A line above the destination rows keeps the running total: “Device attributes referenced across all targets: 3/25.”
The alert tokens on offer differ by alert type. A threshold alert knows the condition you wrote and the reading that tripped it. A connectivity alert knows the outage — which device, offline or back online, how long it was down, when it was last seen — and nothing about a threshold, because no reading is involved. An anomaly alert knows the sensor, the value that broke the rule and its unit, which detection layer caught it, and the mean and standard deviation at the time. So a template copied between alert types can name tokens that do not exist there, and saving will say so. The editor lists what it accepts beneath the template field; that list is the authority.
What blocks saving
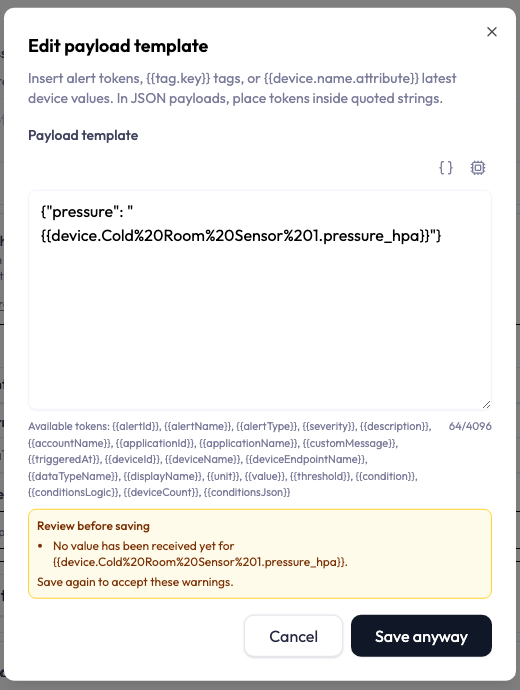
A broken template does not reveal itself until the alert fires, so NEQTO.ai checks it first. What it finds is either a mistake, which blocks saving until you fix it, or a warning, which you accept by pressing Save again. A mistake is anything NEQTO.ai will not keep: invalid JSON, a token this alert type does not offer, a device the alert cannot see. A warning means the template is well formed but a value cannot be confirmed yet. That is legitimate: a device that has not reported is not a mistake. The exact messages are listed under Troubleshooting below.
Delivery outcomes
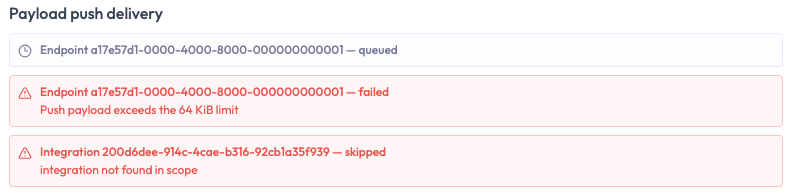
When the alert fires, each destination gets its own line in the event’s Payload push delivery block in Alert History — one line per row, even where two rows point at the same destination. The line names the kind and the destination’s identifier, gives one of three outcomes, and adds a reason where there is one.
| Outcome | What it means |
|---|---|
| queued | The message was built and accepted for delivery, which happens afterwards. Shown with a clock. Nothing has been delivered at this point, and no network attempt has necessarily been made yet. |
| failed | The send itself was refused or went wrong. Shown in red with a warning triangle. The reason says which: a message over the 64 KiB limit, a rendered result that is no longer valid JSON, usage limit exceeded when the monthly push allowance is spent, or, for an endpoint, rate limit exceeded when the per-minute push rate was the problem. |
| skipped | The destination could not be used, so nothing was attempted. Reasons include a destination that has been removed or disabled, an endpoint whose protocol cannot receive a payload push, and a topic override on an endpoint that is not MQTT. |
Two size limits apply, and they measure different things. A template may be 4,096 characters as you type it. The finished message may be 64 KiB after every token has been replaced. A short template full of tokens that expand can pass the first and fail the second, which shows up as a failed line reading “Push payload exceeds the 64 KiB limit”.
Troubleshooting
These mistakes block saving until you fix them:
| What went wrong | What you see |
|---|---|
| A destination row has nothing chosen | “Select a target for every payload push row” |
| A JSON-looking template does not parse | “Payload must be valid JSON when it starts with { or [“ |
| A topic contains a wildcard | “Topics must not contain # or + wildcards” |
| A token is incomplete or mistyped | “A Handlebars token is incomplete or malformed.” |
| A token is not one this alert type offers | “Unknown template token: …” |
| A tag or device token is the wrong shape | “Invalid tag token: …” / “Invalid device token: …” |
| The tag or device is real, but not one this alert can see | “This tag is not available in the alert scope: …” / “This device is not available in the alert scope: …” |
| Two devices share the name, or the device does not report that measurement | “More than one scoped device has this name: …” / “The attribute is not mapped on this device: …” |
| More than 25 device measurements across the alert | “Payload templates can reference at most 25 device attributes across this alert.” |
| The check itself could not run | “Template validation is temporarily unavailable. Please try again.” — treated as a mistake, not a warning: NEQTO.ai will not keep a template it could not check. |
These warnings do not. Press Save again to accept them:
| What it means | What you see |
|---|---|
| Nothing has arrived for that measurement yet | “No value has been received yet for …” |
| The tag exists but holds nothing usable | “The tag currently has no usable value: …” |
| The value could not be checked at all | “The current value could not be verified for …” |
Notification Groups
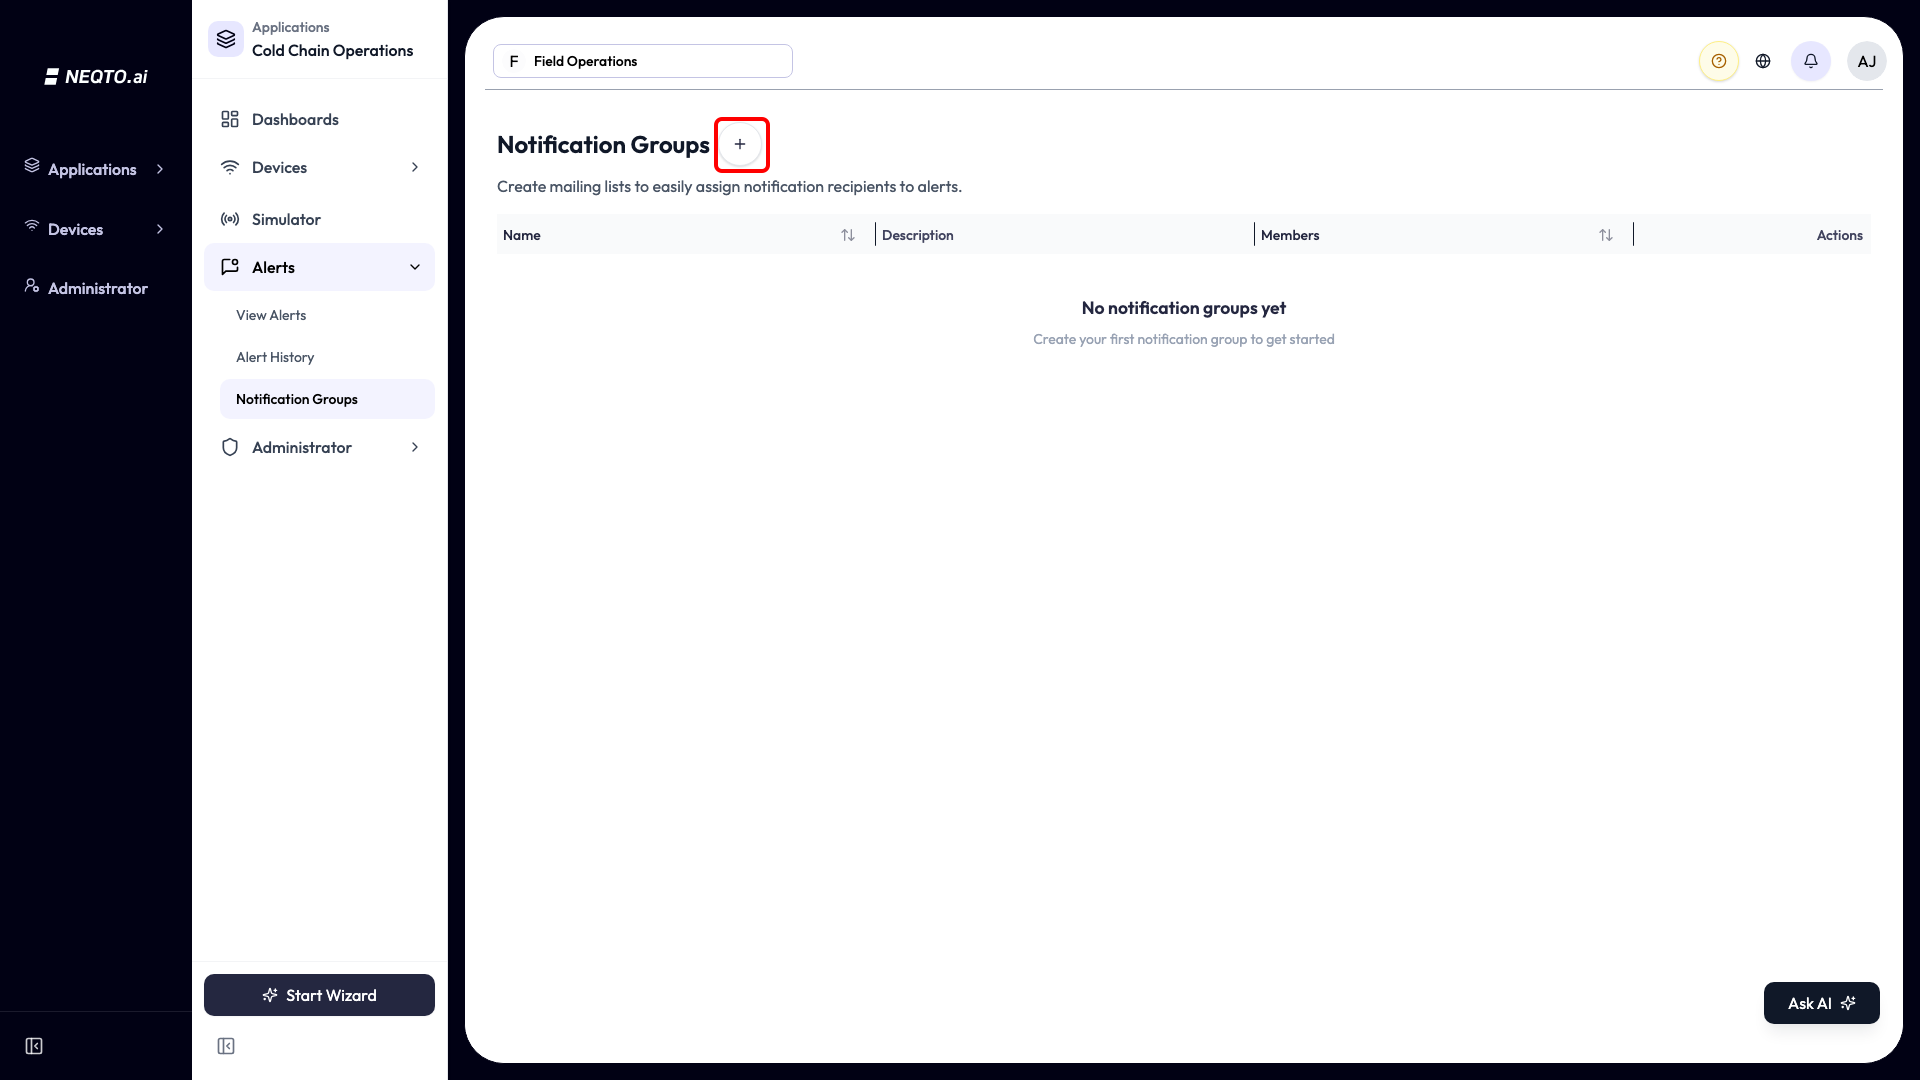
A Notification Group is a reusable recipient list, so you do not re-pick the same people for every alert. Groups are scoped to an application: open an application and go to its Notification Groups page (alongside that application’s Alerts).
-
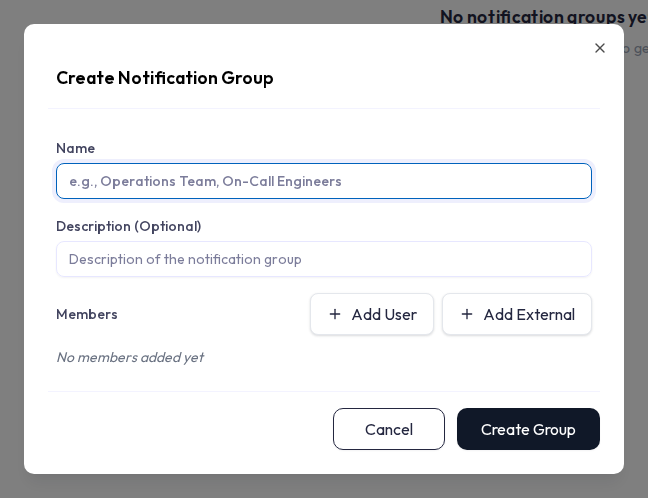
1Click Create Group, give it a Name and an optional Description.
-
2Add members: Add User for account users, or Add External for an email and/or phone number with per-member Email and SMS toggles.
-
3In any alert’s Notifications section, use Add Notification Group to attach the group. When the alert fires, everyone in the group is notified.
Connectivity Alerts
A connectivity alert tells you when a device stops sending data. You do not build these in the Alerts list: each device has its own Connectivity Monitoring tab, and NEQTO.ai creates the underlying alert automatically.
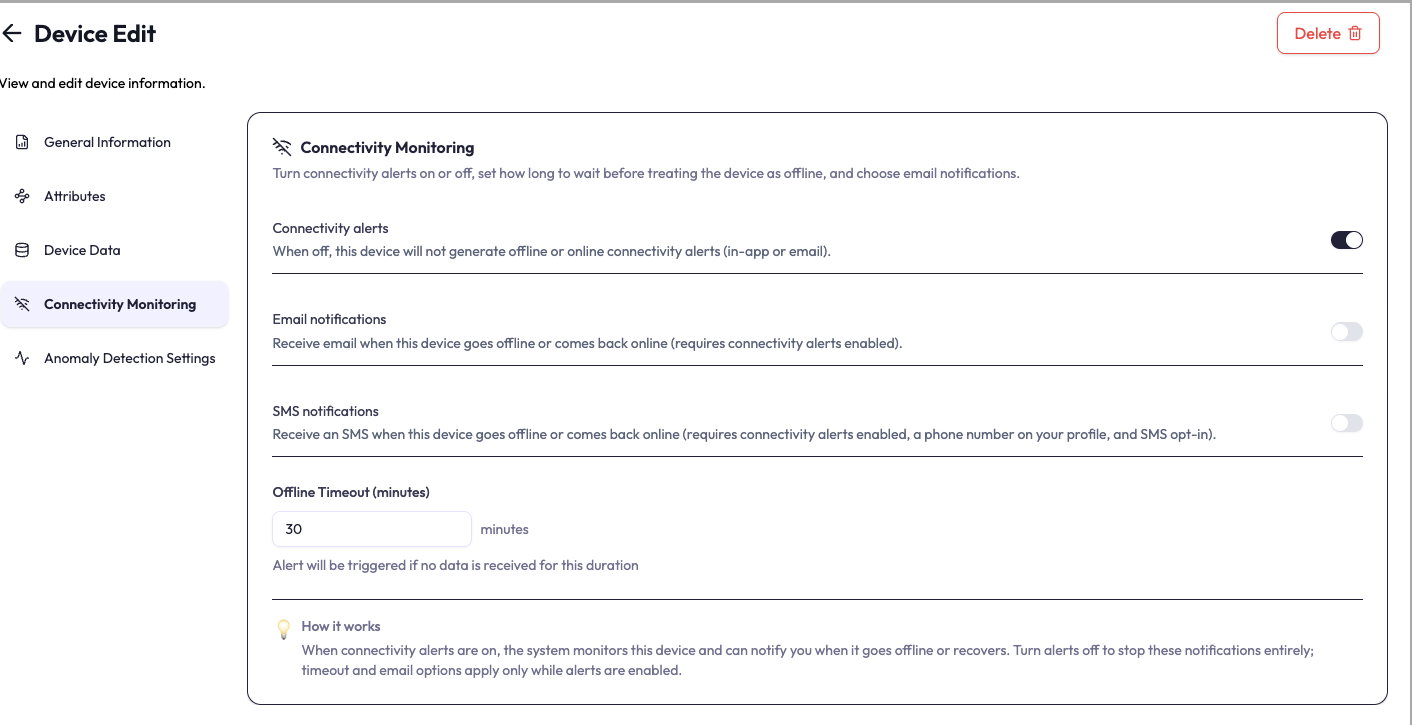
The card’s controls:
| Control | What it does |
|---|---|
| Connectivity alerts | The master switch. When off, this device raises no offline or back-online alerts (in-app, email, or SMS). |
| Email notifications | Also email you when the device goes offline or comes back online. Only applies while connectivity alerts are on. Greyed out when your plan does not include email alerts. |
| SMS notifications | Also text you when the device goes offline or comes back online. Independent of the email toggle; only applies while connectivity alerts are on, and requires a phone number on your profile with SMS alerts enabled. Greyed out when your plan does not include SMS alerts. |
| Payload push | The same payload-push editor the Set Alert dialog has, so going offline or coming back can also send a message of your own to an integration or a device endpoint. See below. |
| Offline Timeout (minutes) | How long to wait with no data before treating the device as offline. The minimum you can enter is 10 minutes. |
How “offline” is decided
A device counts as connected while data keeps arriving. If nothing is received within its Offline Timeout it is marked offline and the alert fires, and when it starts sending again a back online notification says how long it was down. NEQTO.ai re-checks for silent devices on a short, regular schedule, and a per-device cooldown limits how often one device can notify, so a flapping connection does not spam you.
Payload push on a connectivity alert
The same editor, so Payload Push above covers the rules. Destinations belong to the device, and what differs here is where Save lives. The card’s Save Changes button saves them along with the timeout and the two channel switches. So an incomplete destination row stops the timeout beside it being saved too. The whole card is also gated on the Connectivity alerts master switch: with it off, the editor is visible but greyed out. The alert tokens describe an outage rather than a reading.
Anomaly Detection
Anomaly detection flags a single reading that is abnormal, without you setting a fixed number. It learns each sensor’s normal range from its own history. Configure it per sensor on the device’s Anomaly Detection Settings tab.
| Opened from | What the tab offers |
|---|---|
| The account-level Devices list | Warm-up progress, readiness notices, sensor statistics, and the Sigma Multiplier. Links open each application’s anomaly alert settings. |
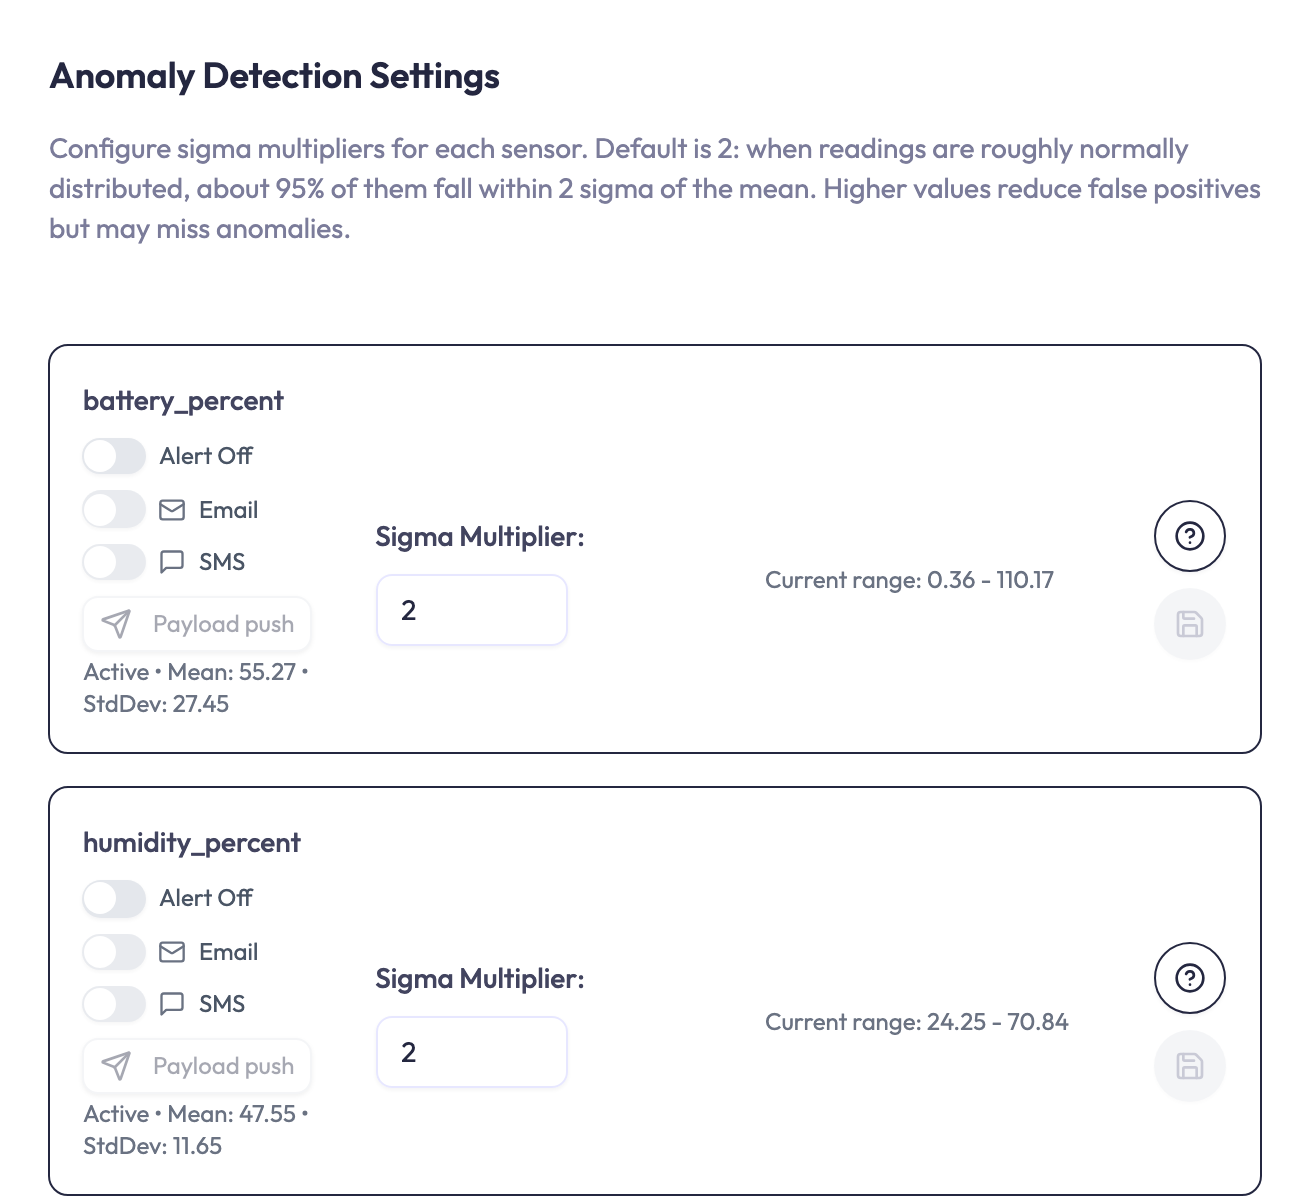
| Inside an application | All of the above, plus each warmed-up sensor’s alert switch, Email, SMS, notification intervals and Payload push. |
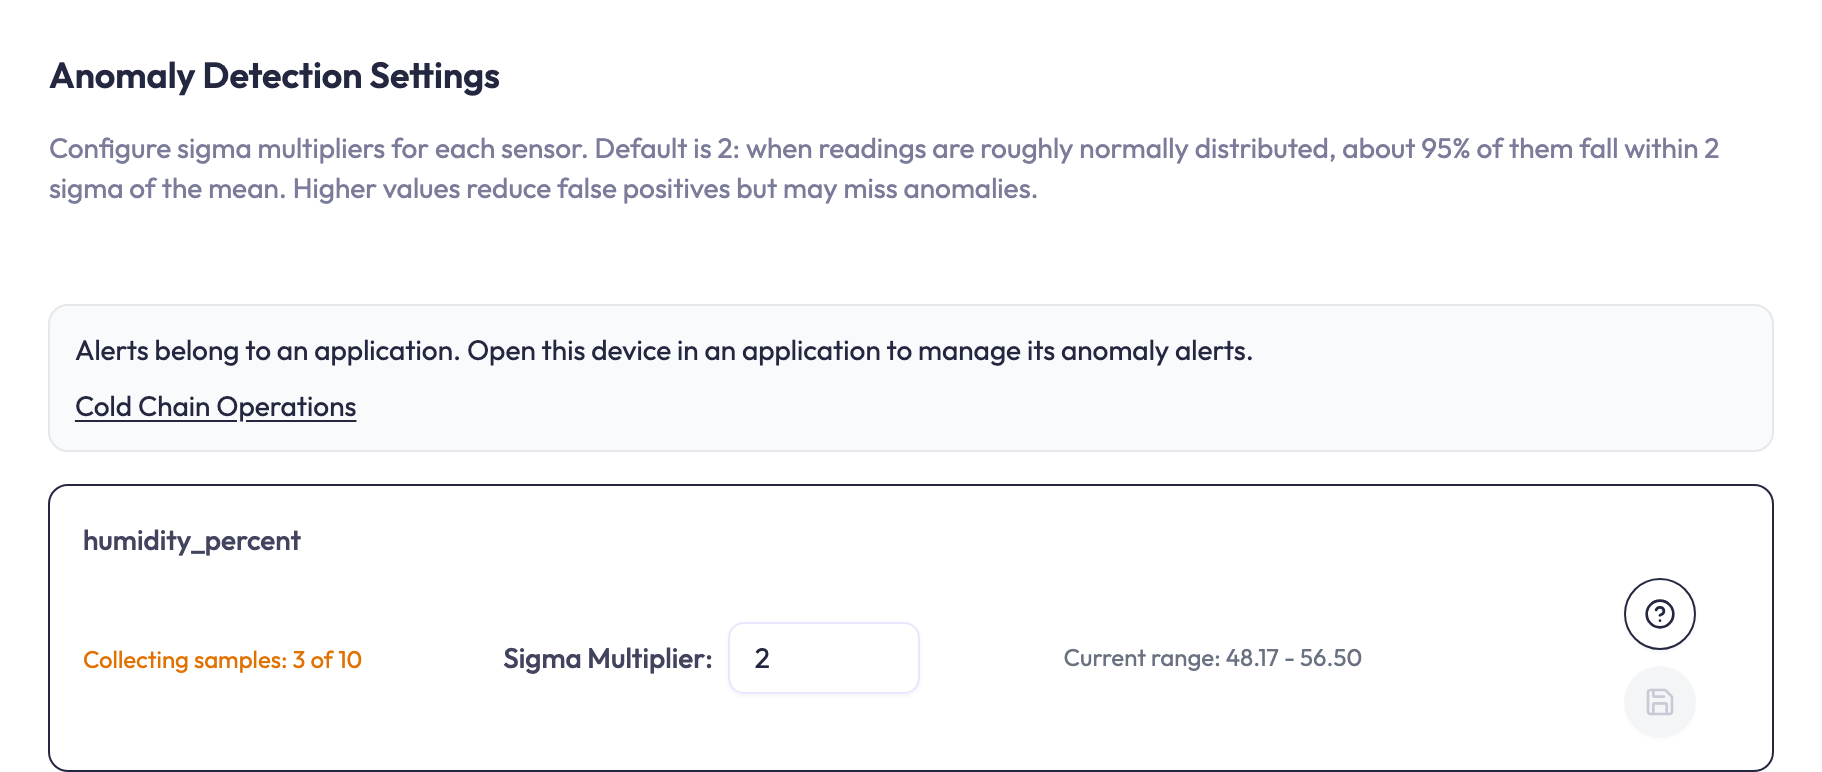
Each sensor’s sigma setting applies across all applications.
How it works
Detection has two layers:
-
Absolute limits. Hard physical bounds per sensor type: temperature in Celsius
is bounded at
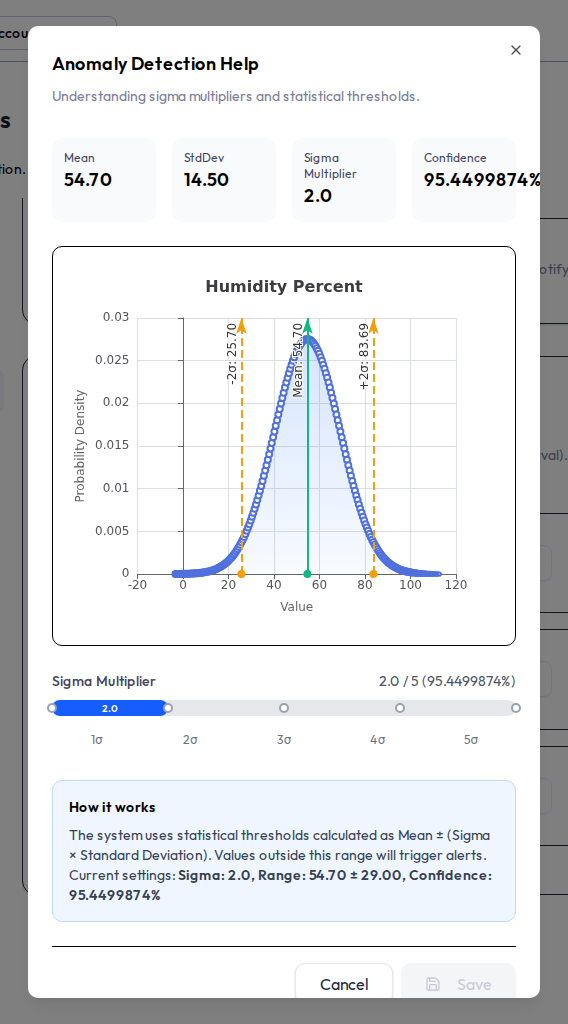
-40to85 °C(Fahrenheit-40to185 °F), humidity and battery at0to100 %, and signal strength at-100to-20 dBm. A reading outside these is always a critical anomaly. Unrecognized sensor types have no absolute limits. - Statistical range. Once a sensor has collected enough readings to finish its warm-up, NEQTO.ai computes its mean and standard deviation and flags readings outside mean ± (sigma × standard deviation). A statistical anomaly is rated warning when the reading is more than 3 standard deviations from the mean, otherwise info.
What you configure
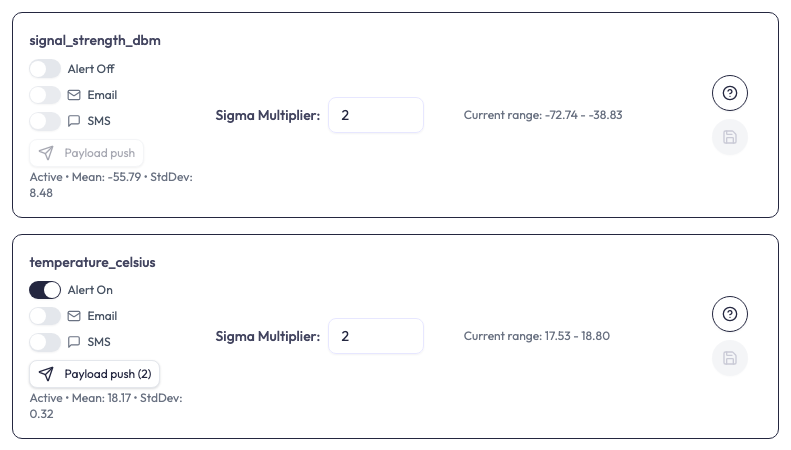
- Sigma Multiplier per sensor, from 1 to 5 in steps of 0.1, default 2. It is the width of the “normal” band: when a sensor’s readings are roughly normally distributed, about 95% of them fall within 2 sigma of the mean. It is a rule of thumb, not a guarantee, because real readings are often not normally distributed. A higher sigma means a wider band: fewer false alarms, but more chance of missing a real anomaly. Change it and click Save on that row.
- Alert On / Alert Off, Email and SMS per sensor. These appear only inside an application, once the sensor has finished warm-up and its anomaly alert exists. Email and SMS are independent of each other and work only while the sensor’s alert is on; SMS also needs a phone number on your profile with SMS alerts enabled. A channel your plan does not include is greyed out.
- Payload push per sensor — a button opening the same editor in a dialog. It sits alongside the On / Off, Email and SMS controls and needs the same two things they do.
- Notification interval per channel — Email every (min) and SMS every (min), each shown when that channel is on. They set how often a sensor re-notifies while it keeps reading anomalous, from 15 minutes to 7 days. Leave one blank for the default of 60 minutes; the value saves when you click away.
Setting names match the sensor’s attribute name exactly — the raw key, such as
temperature_celsius — so they line up with what you see under Device Data.
Warm-up
A sensor needs 10 numeric readings by default before it can raise statistical anomalies. During warm-up its row counts them, for example Collecting samples: 4 of 10. For pull integrations, the row also estimates the remaining warm-up time.
The statistical range updates during warm-up. When warm-up finishes, the row also shows the sensor’s live mean and standard deviation, and NEQTO.ai creates that sensor’s anomaly alert. The Alert On / Alert Off, Email, SMS and Payload push controls appear when that alert exists.
Above the sensor rows, a notice explains anything that keeps the device from learning, along with what to do about it:
| Notice | What to do |
|---|---|
| Anomaly detection is not running right now, so new readings are not being learned from or checked. | Ask an administrator to check the anomaly detection service. This notice replaces the others. |
| This device has not sent any readings yet. | Nothing. Collecting starts with the first numeric reading. |
| This device has not been seen since <time>, which is longer than <window>, so warm-up restarts from zero with its next reading. | If the device normally reports this rarely, set its connectivity timeout on the Connectivity Monitoring tab longer than its reporting interval. For an integration, check that it is active and pulling. |
| The integration feeding this device is paused, so no new readings are arriving. | Resume the integration. |
| This device has no numeric attributes. Anomaly detection only works on numeric values. | Add or map a numeric attribute for the device. |
Individual attributes can carry a line too. A numeric attribute with nothing yet reads Waiting for its first numeric reading., and text attributes are listed after Not available for non-numeric attributes:
Payload push on an anomaly alert
Again the same editor, with Payload Push above covering the rules. Destinations belong to the sensor rather than the device. The button shows how many: a row reading Payload push (2) pushes to two places. Setting them on temperature does nothing to humidity. Save here is the dialog’s own and saves only the destinations, unlike the connectivity card. The button needs that sensor’s alert switched on, and a sensor’s alert arrives off, so a newly warmed-up sensor has to be turned on first. The alert tokens describe the sensor and the value that broke its rule.
Alert History
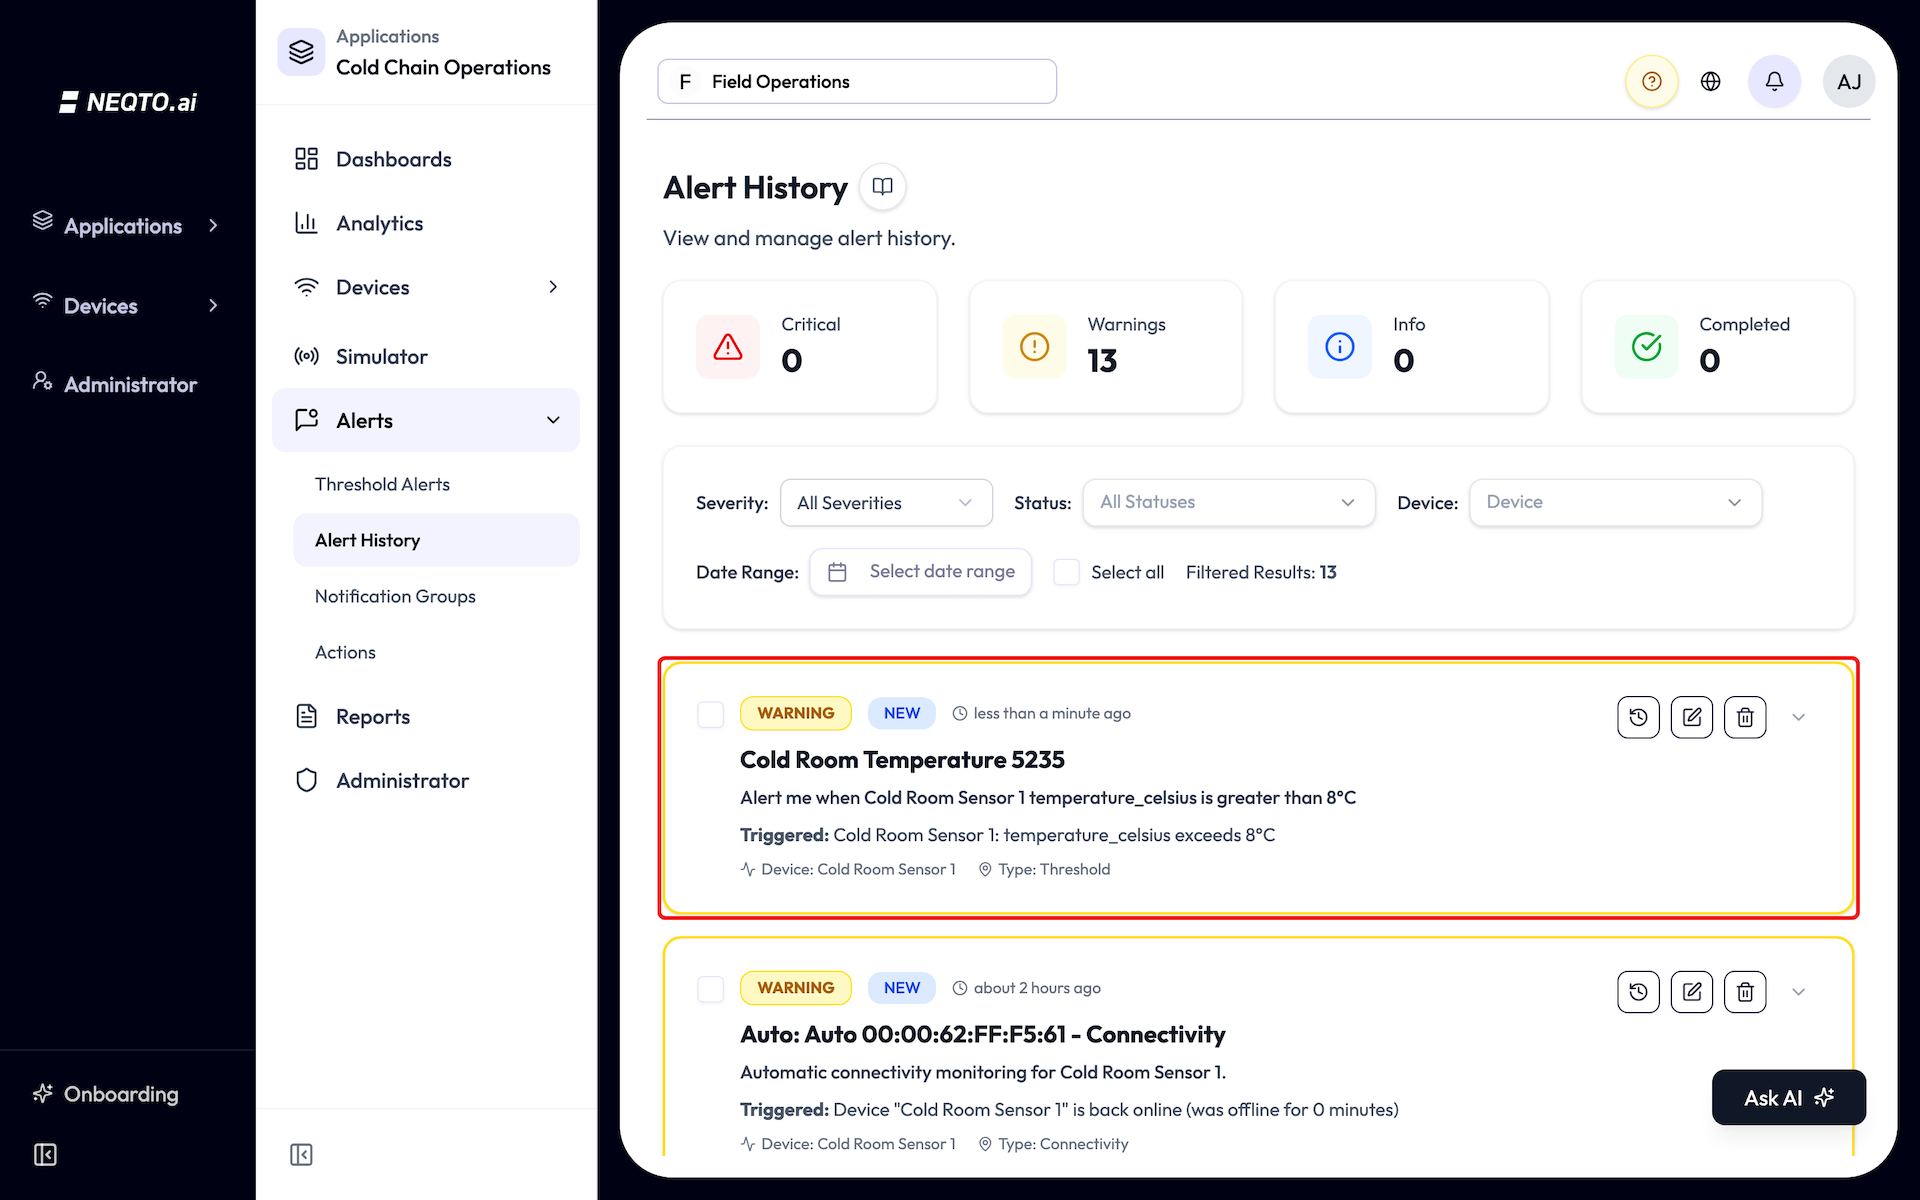
Every time an alert fires it creates an event. Alert History is where you review, triage, and clean up those events. It belongs to an application: each one has its own, reached from Alerts → Alert History in that application’s sidebar.
Event status
Each event carries a workflow status you can update as you handle it:
| Status | Meaning |
|---|---|
| New | Just fired, not yet looked at. |
| In Progress | Someone is working on it. |
| Pending | Waiting on something else. |
| Completed | Resolved. |
| Dismissed | Acknowledged and set aside. |
Status changes are recorded, so each event keeps a history of who moved it where.
Expand an event to see what each condition looked like when the alert fired. A condition that carried a calculation adds three lines. Formula is the formula it used. Calculated value is the number that formula produced. Raw value is the reading the device actually sent, kept because the first question about a surprising alert is always what the device reported.
On a calculated condition the Actual Value line above them holds the calculated number rather than the device’s reading, and neither is shown with a unit.

Two normal cases can look like missing data. An event recorded before calculations existed shows none of these three lines, exactly as it always did. And a condition the platform did not evaluate on that pass — routine when an alert covers several devices and only some of them reported — shows its formula with neither number beside it.
Filtering and cleanup
- Filter by Severity (All Severities, Info, Warnings, Critical), by Status, by Device, and by a Date Range picker. Status and Device take several values at once: pick New, In Progress and Pending together to see everything still open, or several devices to see their events side by side. Leave either empty to include everything. The summary cards also toggle a severity, or Completed.
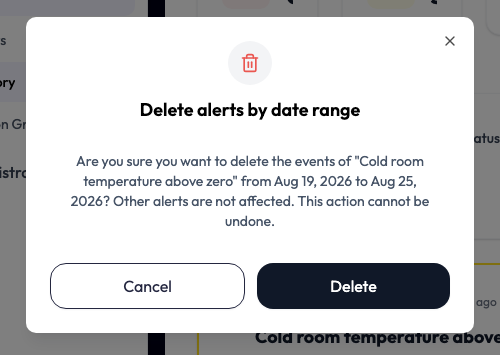
- Use the select-all checkbox to pick events and Delete selected in bulk, or set a date range and Delete by date range. Both ask for a confirmation, and both need the alert-delete permission.
The red open alert counts on an application’s device rows and Systems lead here. Clicking one opens Alert History in a new tab with the Device filter set to that device, or to the devices in that System’s subtree, and Status set to New, In Progress and Pending. The list opens on its first page, with the most recently fired event first. See Endpoints & Devices and Systems.

What the view is narrowed to changes what a range delete covers. Alert History opens showing every alert’s events, and a range delete there reaches all of them. Narrowed to a single alert it reaches only that alert’s events — and that narrowing is the only thing that changes the answer.
| The view | What Delete by date range covers |
|---|---|
| Not narrowed to an alert — how the screen opens | Every alert’s events in the range. None of the severity, status or device filters narrows a delete to one alert. |
| Narrowed to one alert — an Alert: chip sits above the filters | Only that alert’s events in the range. Every other alert’s events are left alone. |
That narrowing is not a dropdown — nothing on the screen lets you choose an alert. It arrives by following a link. On a dashboard, an Alert List widget shows one row per alert with its open event count; clicking that count opens the application’s Alert History in a new tab, already narrowed to that alert, with its latest open event expanded when it has one. A small Alert: <name> chip appears above the filters, and clearing it widens the view — and the delete — back to every alert. The widget itself is covered on the Dashboards page.
The two confirmations are worded differently, and that wording is how you tell them apart:
- Not filtered to one alert — “Are you sure you want to delete all alert events from <start> to <end>? This action cannot be undone.”
- Filtered to one alert — “Are you sure you want to delete the events of “<alert>” from <start> to <end>? Other alerts are not affected. This action cannot be undone.”
Alerts shown across the app refresh on their own when the platform pushes an update, and immediately after you create or edit one, so lists and counts stay current without a manual reload.
Investigate with AI
On an alert event inside an application, Investigate with AI asks the assistant to look at what happened. For events tied to numeric readings, it checks the Last 7 days and Last 24 hours before the event fired, then reports back in three parts. Other event types can be investigated without those reading windows.
The button needs Ask AI access in the application. Without it the button is hidden, though an investigation someone already saved stays readable. Under the button a line estimates the extra cost and shows your balance, for example About 12 additional credits, plus the chat prompt. The chat prompt is charged as it is in chat, so the line names it without a number.
| Part | What it contains |
|---|---|
| Observations | What the readings actually show, without interpretation. |
| Likely causes | Possible explanations, each rated by how well the data backs it up: Supported, Possible or Insufficient. |
| Suggestions | What to do next, each typed as Check, Configure, Monitor or Inspect on site so you can tell a desk job from a trip to the equipment. |
Where the assistant could not find what it needed, a Missing evidence note says so. When it examines numeric readings, Readings examined names each window, how many readings it found, at what granularity, and the exact period covered. That is how you judge the answer: a confident-sounding conclusion drawn from two readings is worth less than a hedged one drawn from two thousand.
The result is saved to that event’s status history, attributed both to the assistant and to the person who ran it, so the next person to open the event sees what was already looked into and by whom. Run it again with Investigate again if readings from before the event have arrived late. The windows still end when that event fired; readings taken afterward need a newer event to be included. While an investigation is running, Cancel investigation stops it; where one has failed, the same button reads Dismiss and clears the error. Neither deletes a result that has already been saved — a saved investigation stays in the event’s history, and running a new one is how you supersede it.
Three things can interrupt the save, and they call for different responses. If the recorded evidence for the event changed while the investigation was running, its result no longer matches that event, so run a new investigation. Editing the alert rule or the event’s status does not cause this conflict. If the save was simply not confirmed, retry saving without running the investigation again. If the result is rejected outright, reload the alert before trying again.
An investigation can also fail to finish. It may run out of time on the server, or no answer may arrive before the page stops waiting after ninety seconds. Either way nothing is saved, and running it again is safe. If the account does not have enough AI credits, the investigation stops with There were not enough AI credits to complete the investigation.
Muting Your Own Alert Notifications
You can silence alert notifications to yourself across the whole platform. This is a personal preference on your own account, not a change to the rules other people see.
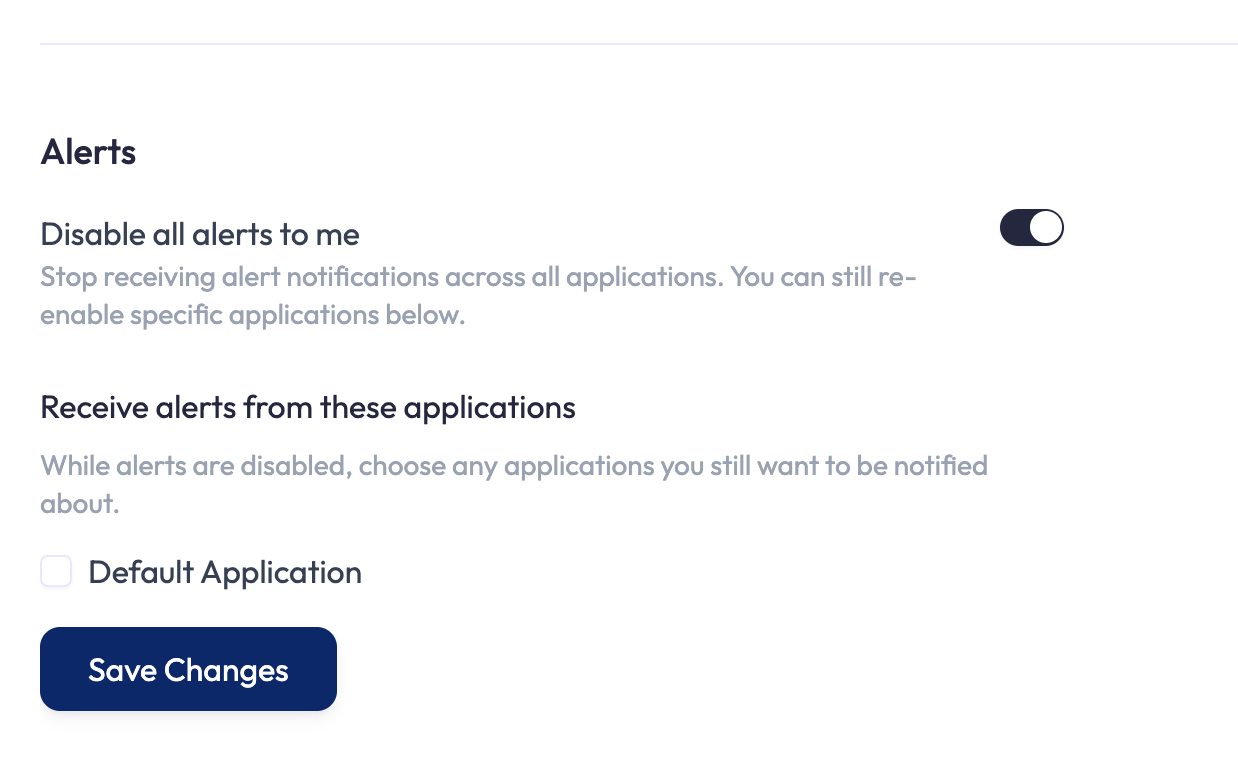
Open Settings and find the Alerts section. Turn on Disable all alerts to me to stop receiving alert notifications everywhere. While it is on, a Receive alerts from these applications list lets you tick the applications you still want to hear about.
Muting is per person, not per alert. The alert still fires, is still recorded in Alert History, and everyone else on the recipient list is notified as normal. To stop an alert firing for everyone, disable the alert itself or use its unlock settings.
Limits and Good to Know
Every number on this page, in one place.
| Item | Value |
|---|---|
| Conditions per threshold alert | 1 to 10 |
| Unlock conditions per alert | Up to 10 |
| Unlock timer minimum | 1 minute (field defaults to 60) |
| Repeat-notification gap (older alert with no unlock set) | 24 hours per rule |
| Connectivity offline timeout | 10 minutes minimum |
| Anomaly sigma multiplier | 1 to 5 (steps of 0.1), default 2 |
| Readings before an anomaly sensor finishes warm-up | 10 by default |
| Re-check after a tag used in an alert calculation changes | About every 30 seconds |
| Variables in a condition’s calculation | 5 (a widget’s allows 20) |
| Building blocks in a condition’s calculation | 25 (a widget’s allows 50) |
| Nesting depth in a condition’s calculation | 8 (a widget’s allows 12) |
| Length of a condition’s calculation | 4,096 characters (a widget’s allows 32,768) |
| Payload push destinations per alert | 5 (Add target greys out at five) |
| Device measurements a payload template may reference | 25 per alert, counting each distinct measurement once |
| Length of a payload template | 4,096 characters as written |
| Size of a pushed message | 64 KiB after every token has been replaced |
| Topic override length | 256 characters, and no # or + |
| Push rate for endpoint destinations | Your account’s Data Push rate limit, account-wide. 60 per minute when your plan sets no usable value |
| Push history for endpoint destinations | Your account’s Data Push history retention. 90 days when your plan sets no usable value |
What a push costs
A payload push to a device endpoint is an ordinary data push, so it spends your account’s Data Push allowance — the same budget and history as anything else you send to your devices. The limit is account-wide, not per endpoint, so alerts pushing to four endpoints draw on the same allowance as alerts pushing to one. If your plan carries no usable rate limit or retention, the platform substitutes 60 pushes per minute and 90 days of history rather than reading an unset value as “no pushes” or “expire immediately”. Integration destinations spend the monthly allowance too, but not the per-minute rate, and they do not appear in the endpoint Data Push history, so not finding one there is expected. An integration push refused because the monthly allowance is spent is recorded as failed, with the reason “usage limit exceeded”, when the queue reaches it.
When a push is refused because the budget is spent, Alert History records that destination as failed, with the reason “usage limit exceeded” or “rate limit exceeded”. The Data Push allowance itself is covered on the Data Push page.