

Reports
A Report turns an application’s device history into a file and emails it to people. You choose how often it runs, which devices and attributes it covers, and who receives it; NEQTO.ai builds a CSV or PDF from the stored hourly summaries and sends it out. Reports sit in their own section of the application sidebar.
Reports have their own four permissions, listed in full on the Administration page. Two things about them are easy to trip over. Being able to see a report is not enough to download its file: downloading and resending also need permission to view devices and, on a report carrying the Alert or Anomaly summary, permission to view alerts as well. And those two sections cannot be switched on at all without permission to view alerts.
Quick Start
Creating a recurring report, end to end.
-
1Open Reports inside your application and use the plus button. Choose a recurring schedule or a one-time report.
-
2On Schedule, name the report and pick a cadence, a timezone and a delivery time.
-
3On Content, accept the defaults (all devices, all their attributes) or narrow them, and choose the format and any extra sections.
-
4On Recipients & review, add recipients and read the preview and the coverage estimate.
-
5Save. The first run starts on its way immediately; later runs follow the cadence.
The Three-Step Wizard
One dialog, three steps. Move with Back and Next, or select a step directly.
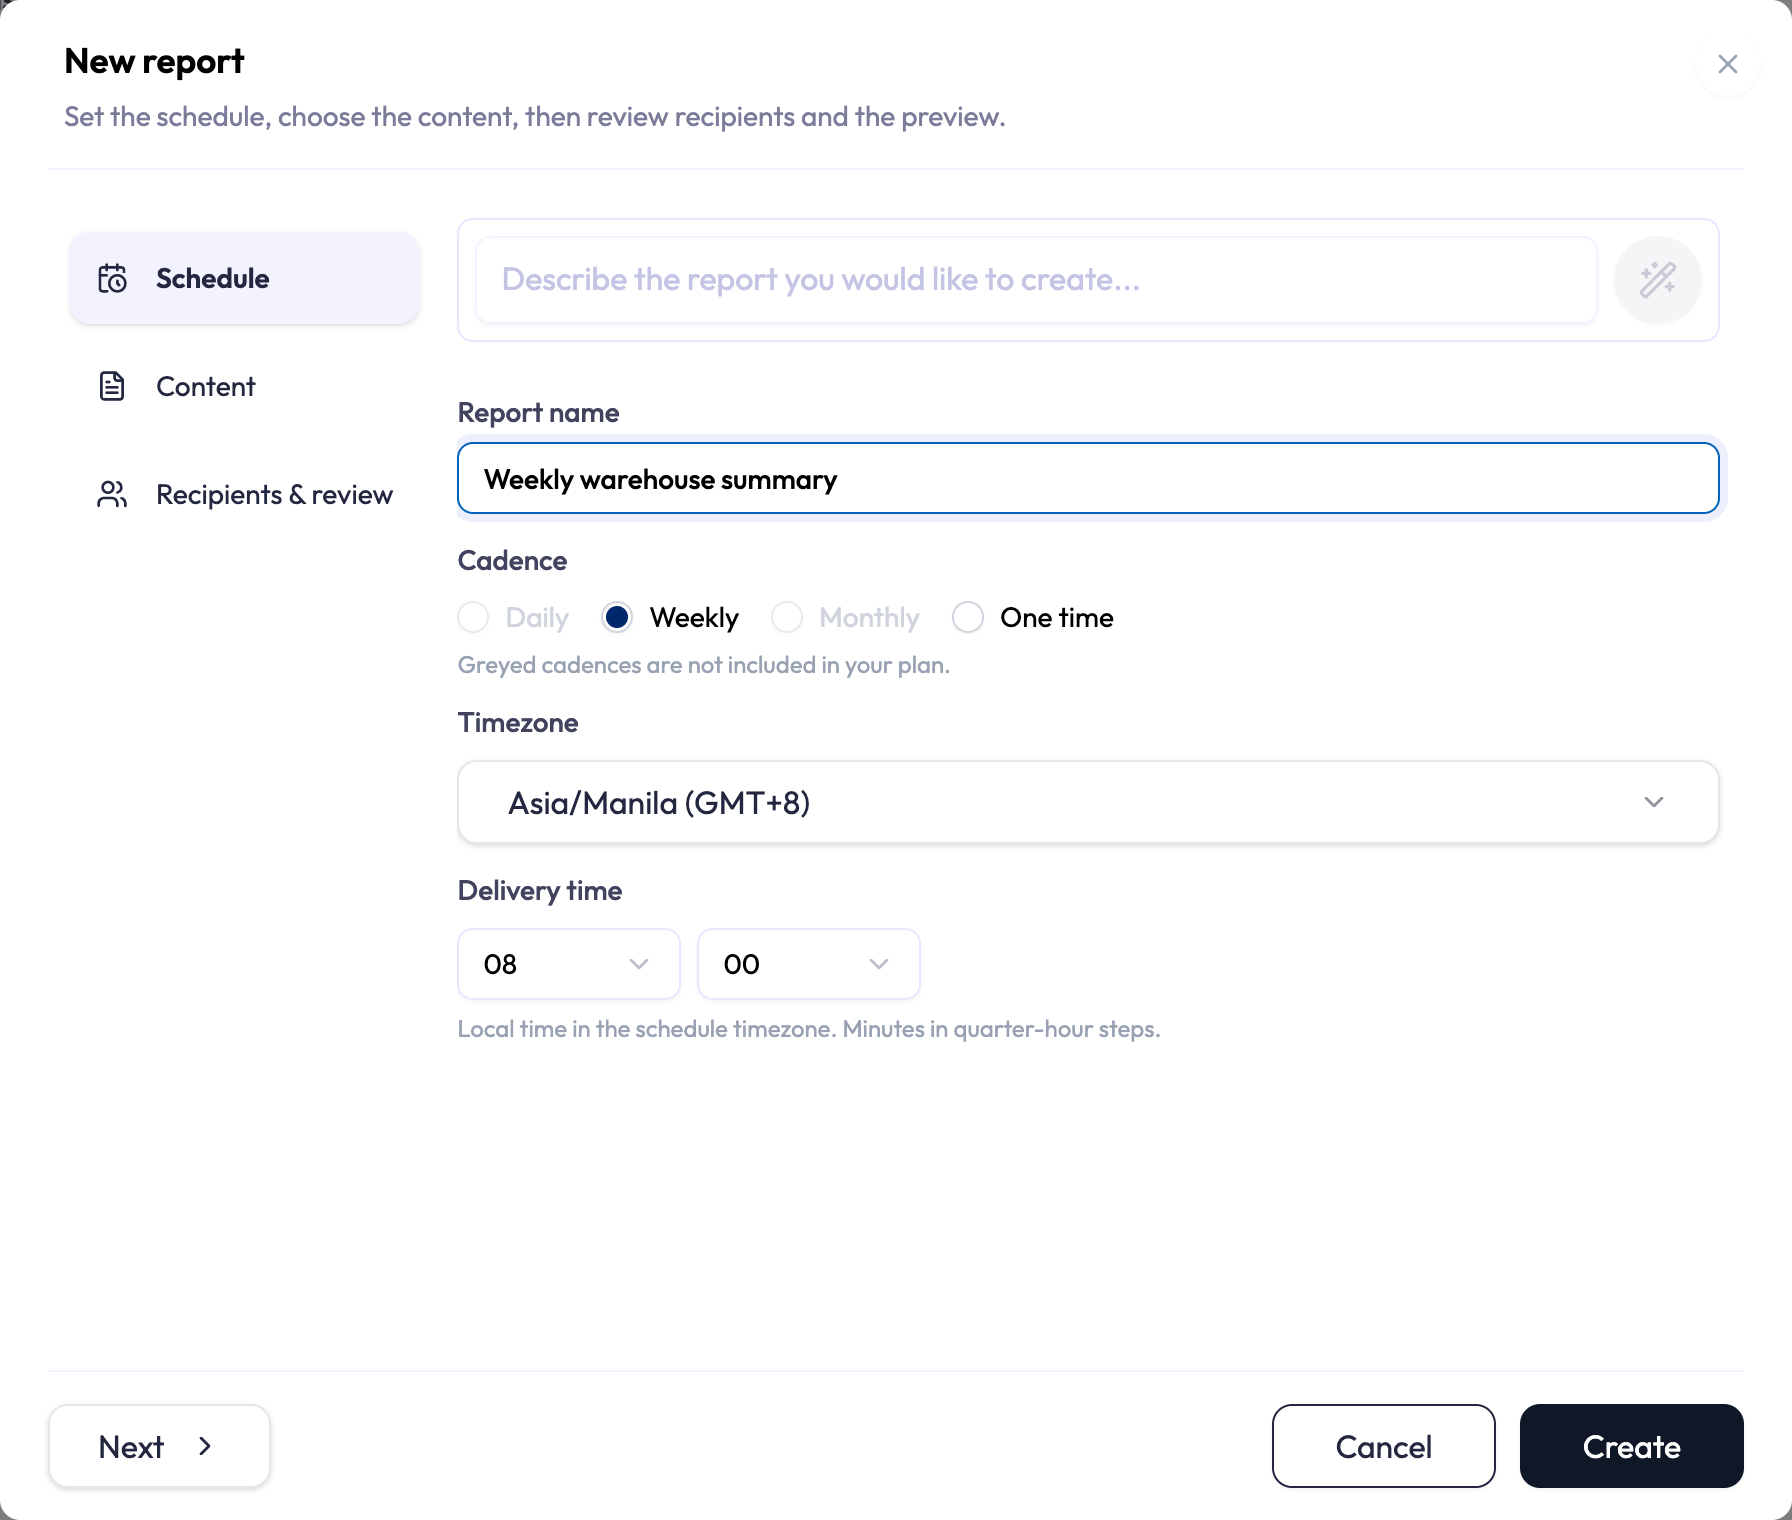
Step 1: Schedule
- Report name — up to 200 characters.
- Cadence — Daily, Weekly, Monthly or One time. Which of these you may pick depends on your plan; see Plan Limits below.
- Timezone — the schedule’s own timezone. Delivery times and, for weekly and monthly reports, the day boundaries are interpreted in it.
- Delivery time — a local hour in that timezone, with minutes in quarter-hour steps.
- Report period — for a one-time report only. A closed period: it must end in the past, start within the available history, and cover at most 90 days.
Step 2: Content
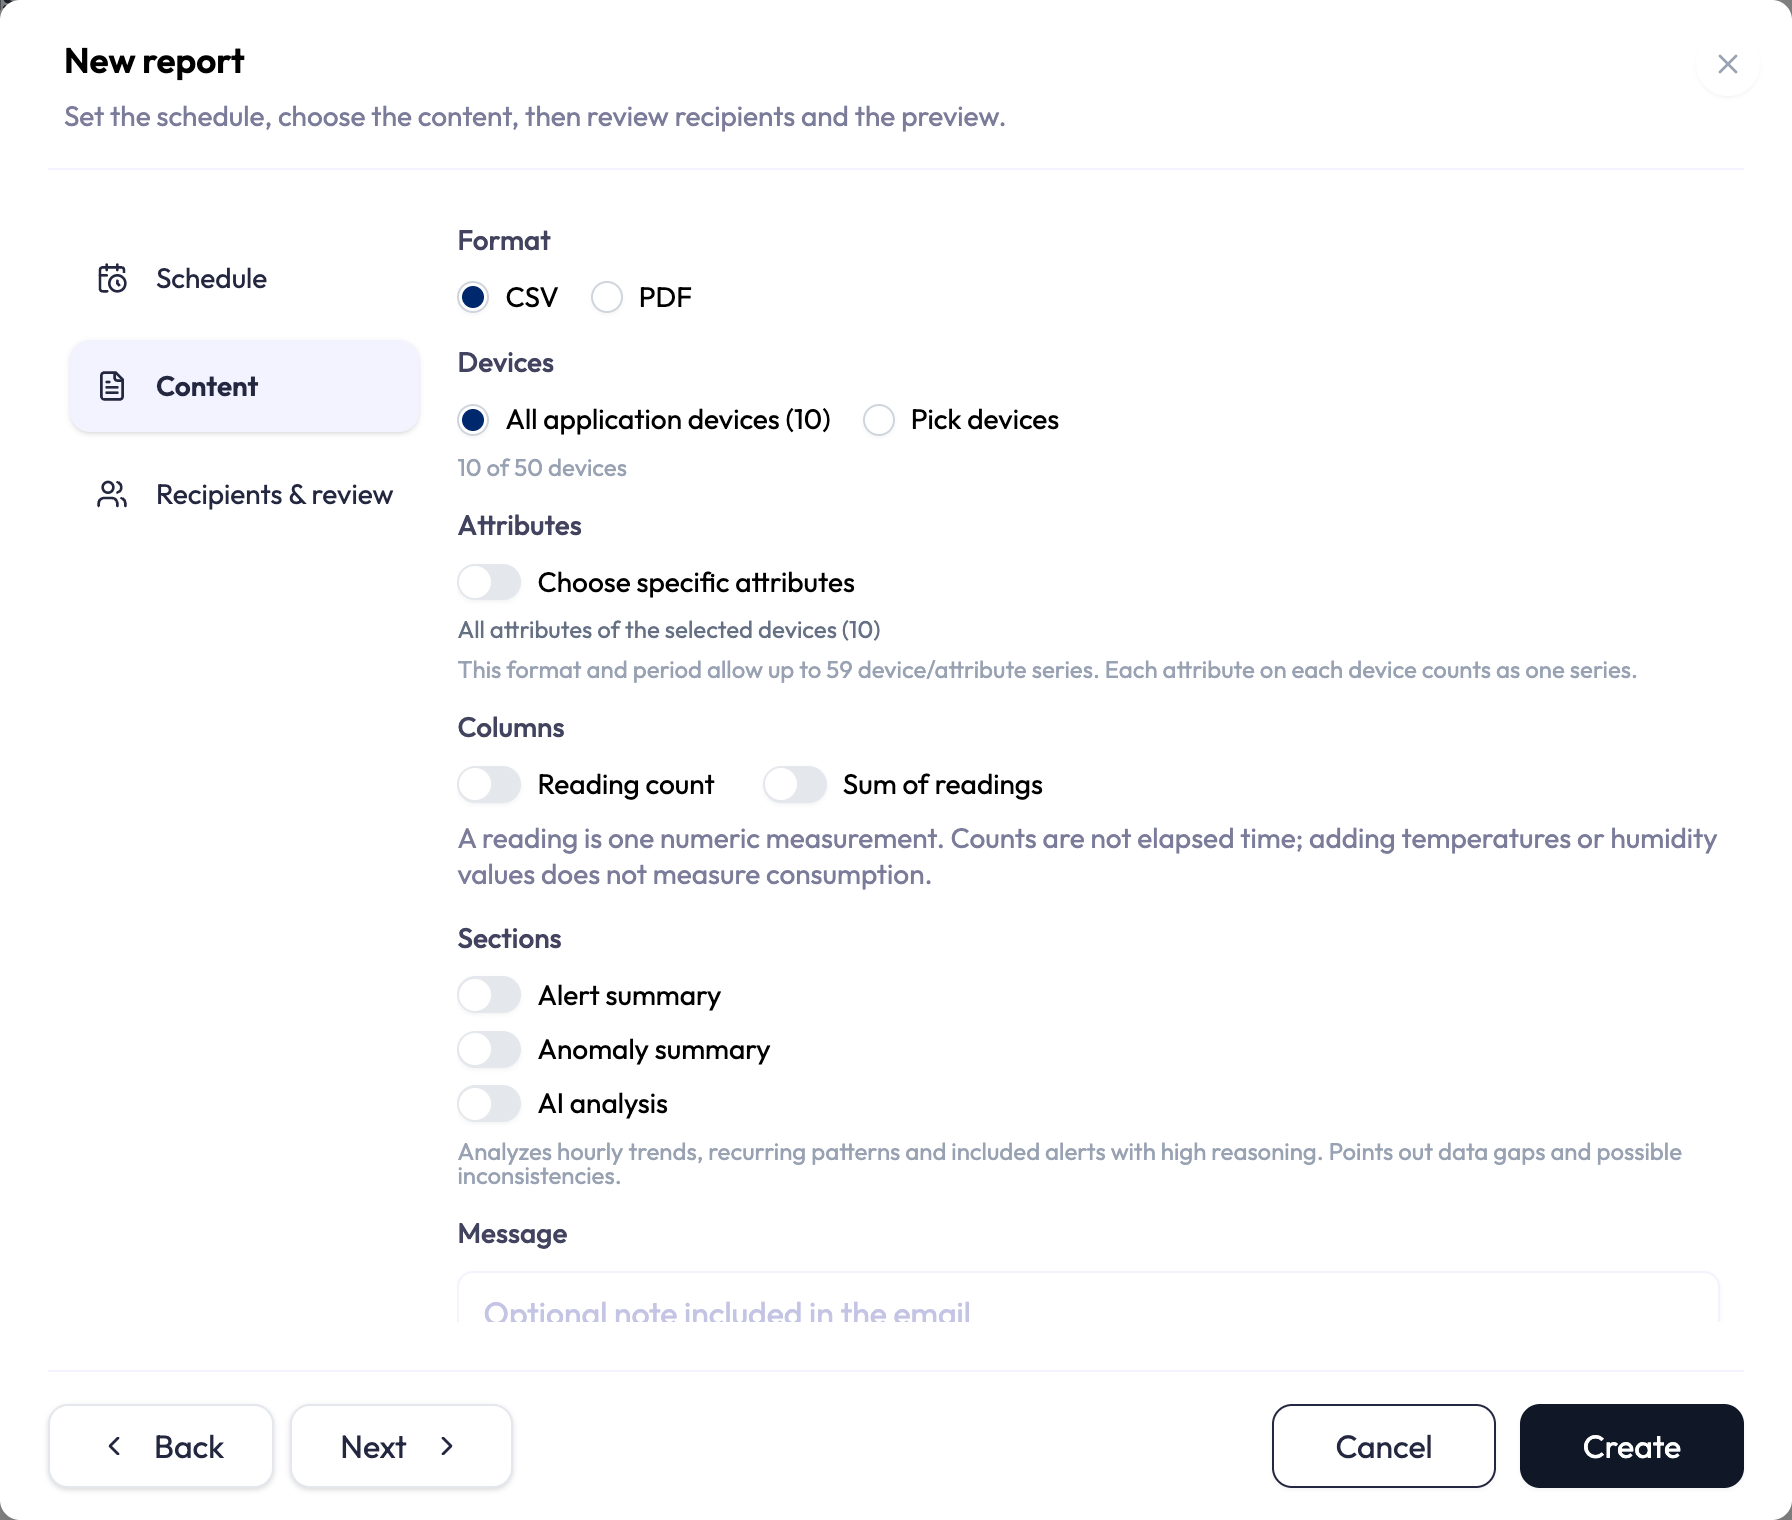
- Format — CSV or PDF. CSV keeps hourly detail in one table. A PDF adds a cover, trend lines and range bars, and for longer periods groups its tables by day.
- Devices — every device in the application by default, or switch to Pick devices to choose your own.
- Attributes — every attribute of the selected devices by default, or switch to Choose specific attributes to choose your own.
- Columns — optionally add Reading count and Sum of readings alongside the values.
- Sections — optionally add an Alert summary, an Anomaly summary, and an AI analysis that reads the hourly trends, recurring patterns and included alerts, and points out data gaps and possible inconsistencies.
- Message — an optional note included in the email, up to 1,000 characters.
Step 3: Recipients & review
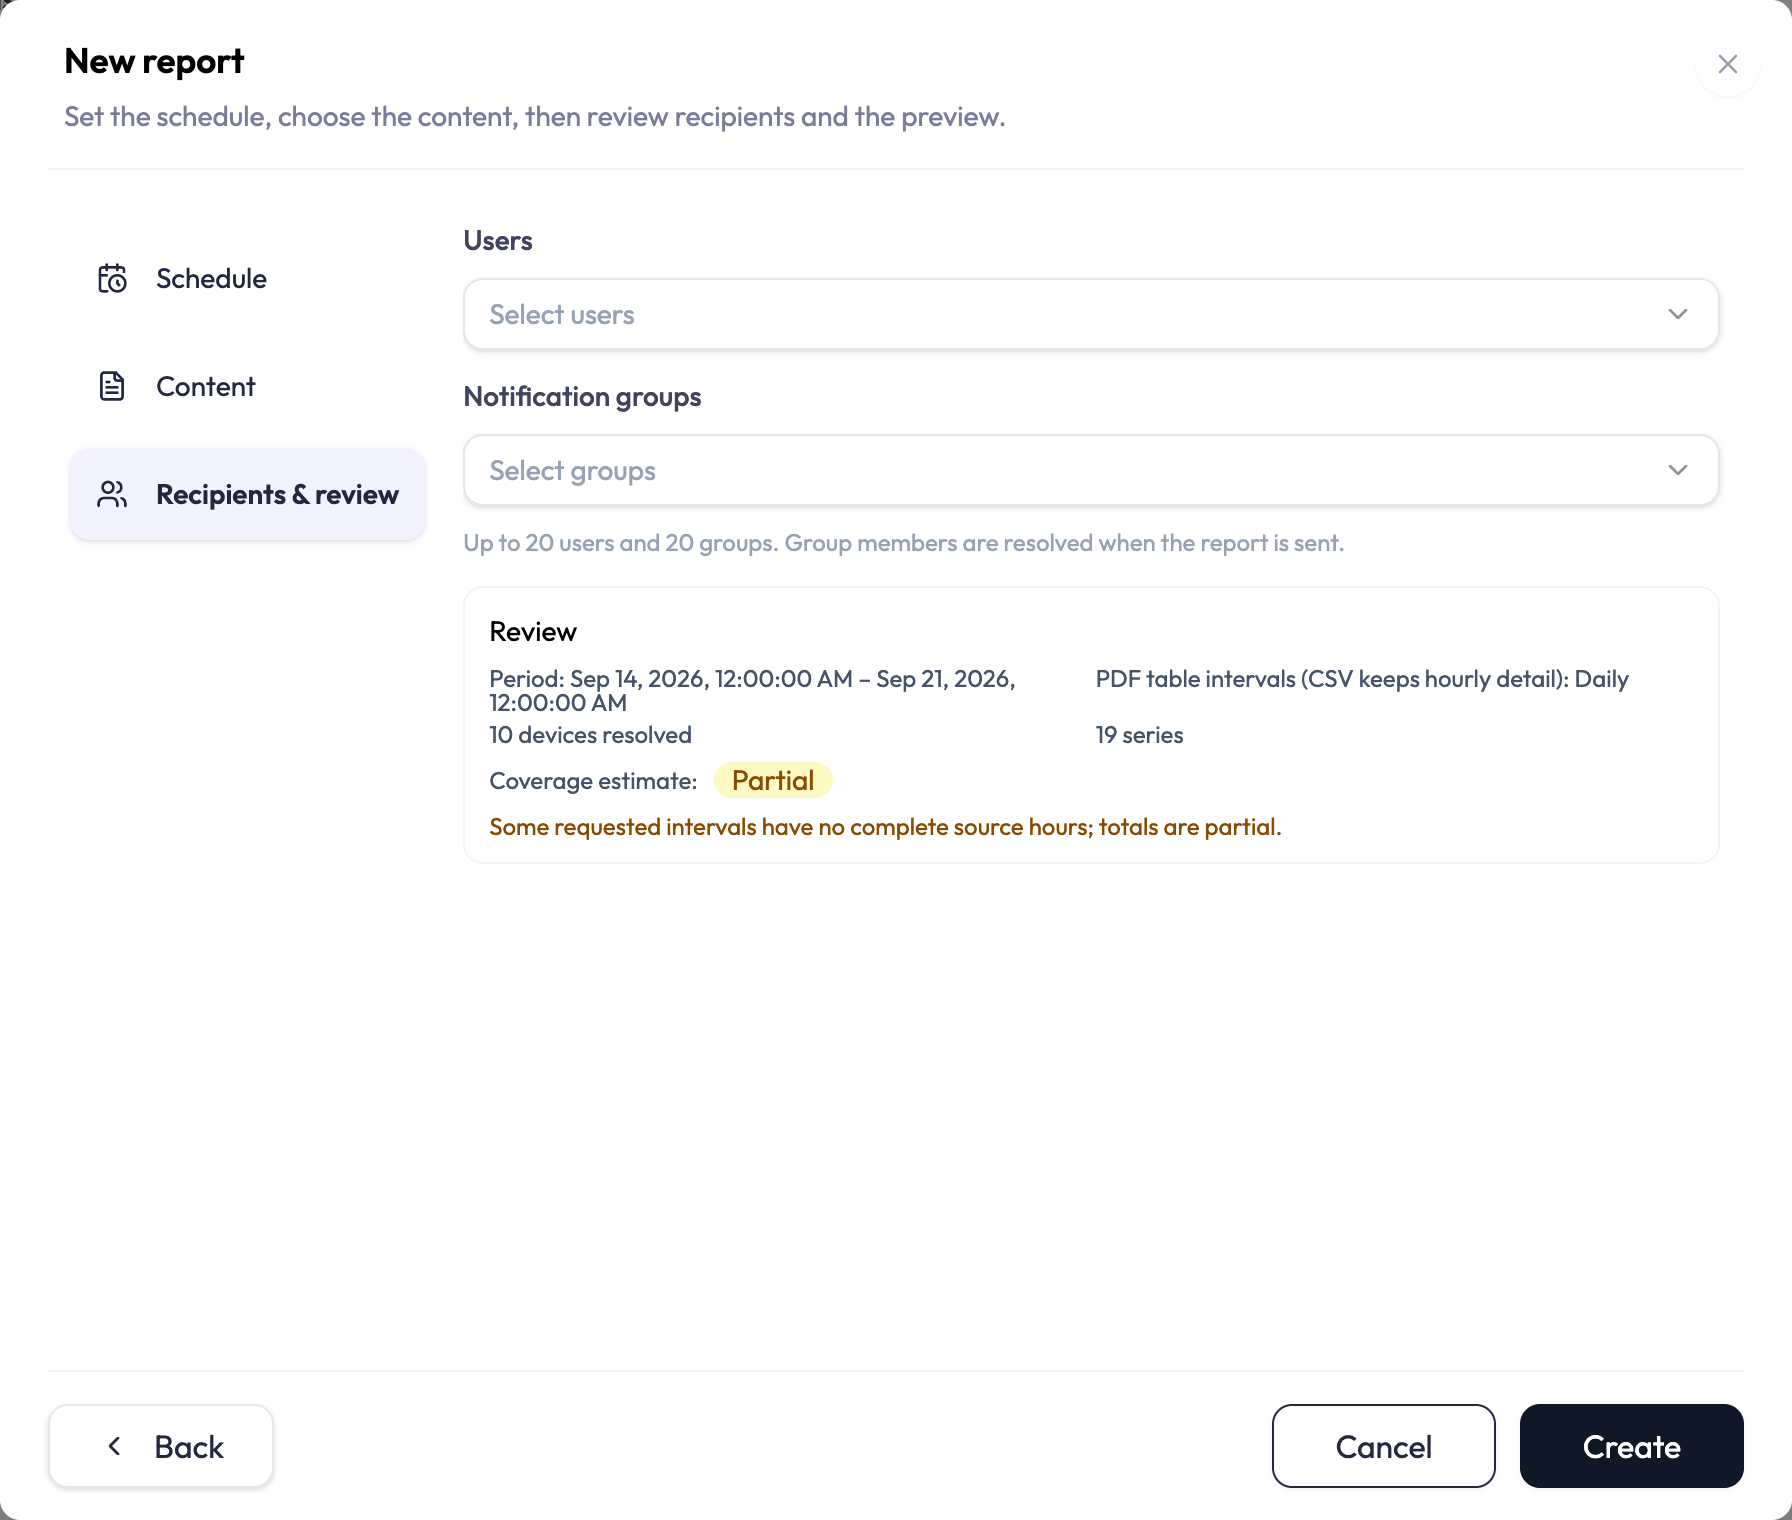
- Users and Notification groups — you may pick up to 20 of each, but the cap that actually binds is 20 unique email addresses once the groups are resolved. Twenty users plus one group is allowed if the group’s members do not add a new email address. Group membership is resolved when a run is generated, so adding somebody to a group adds them to future deliveries without touching the schedule.
- Review — a summary of what you have configured: the period, the number of devices resolved, the series count, the table interval a PDF will use, and the coverage estimate. It is a summary rather than a sample document; no report is rendered until a run happens.
Draft with AI
Describe the report you want in plain language and let the assistant fill the form in.
The field sits at the top of the wizard when you are creating a report. Unlike the alert editor, it is not offered when editing an existing schedule. Type something like a weekly PDF of the warehouse temperature sensors, every Monday morning, to the facilities team and the assistant fills the fields it can work out. Each field it inferred rather than took from you is marked AI-inferred, so you can see what to check before saving.
- Drafting with AI — the request is with the assistant.
- Draft applied to the form — fields were filled in.
- Nothing new to apply — the assistant had nothing to add.
- The assistant asked — it needs something from you before it can draft.
Plan Limits
Three separate limits govern how many reports you can run.
- Which cadences you may use comes from your plan. Cadences your plan does not include are greyed out and cannot be selected. One time is available whenever your plan includes at least one scheduled cadence; a plan with no scheduled cadences at all cannot create reports.
- How many schedules may be active at once also comes from your plan. The counter above the list shows where you stand.
- How many complimentary creations you get in a rolling 24 hours — five by default, and adjustable per account. The counter shows how many you have used and when the next slot frees up.
The Coverage Estimate
Before you save, the review step tells you how much of the period actually has data behind it.
| Estimate | What it means |
|---|---|
| Complete | Every device-hour the report asks for has a stored summary behind it. |
| Partial | Some are missing. The estimate names how many device-hours it found out of how many it expected, and lists the missing intervals. |
| Not estimated | Coverage could not be worked out for this selection. |
Run History and Delivery
Every run is listed with its period, the devices it covered, its status, and what happened to each recipient.
Run status
A run moves through Queued, Collecting and Rendering to either Ready or Failed. Two other states are worth recognising: Waiting for data means the hourly summaries for the period are still being written and the run will try again shortly, and Expired means the file has passed its retention window and can no longer be downloaded. A run that was stopped before it finished, typically because its schedule was deleted, reads Cancelled. A run can also pass through other short-lived states while it is being finalised; those resolve on their own, or the run ends up reading Failed. The list refreshes itself while any run is still active.
Delivery status
Each recipient gets their own status: Pending, Sending, Accepted, Failed, Skipped, or Uncertain. Each schedule’s row carries a one-line summary of its latest run, counting how many recipients were delivered to and how many were not confirmed.
Download and resend
- Download is available once a run is Ready. Files are kept for 90 days, and each download link you open is valid for 24 hours. Once the file expires it is gone, and the report has to be generated again.
- Resend email re-delivers the existing file to the configured recipients. No new file is produced and nothing is recalculated.
Managing a Schedule
What each row action does.
| Action | What happens |
|---|---|
| Generate now | Builds a new file for the most recent completed period and emails it, without waiting for the cadence. In the schedule’s timezone, that means the previous day, the previous Monday-to-Sunday week, or the previous month. A one-time report uses the date range you selected instead. Only one manual run per schedule can be in flight at a time. An account may have at most five outstanding manual runs across all of its schedules. |
| Pause / Resume | Stops and restarts the cadence. Resuming re-checks your plan, so it can be refused both when you have since filled your schedule limit with other reports and when the schedule’s cadence is no longer included in your plan. |
| Edit | Changes apply to future runs only. Saving an edit never creates a run and never changes a file that already exists. |
| Delete | Stops the schedule and cancels queued work. Files that have already been produced stay downloadable until they expire. |
Limits and Good to Know
Every number on this page, in one place.
| Item | Value |
|---|---|
| Devices per report | 50 |
| Attributes per report | 10, whether you pick them or take the default |
| Device and attribute series | Up to 100, and lower wherever the format and period cannot fit that many. A PDF is effectively capped near 20 by its chart budget |
| Recipients | 20 users and 20 groups selectable; 20 unique email addresses after groups resolve |
| Report name | 200 characters |
| Email message | 1,000 characters |
| Available history | 90 days |
| One-time report period | At most 90 days, and it must end in the past |
| Complimentary creations | 5 per rolling 24 hours by default, adjustable per account |
| Delivery time granularity | Quarter-hour steps |
| PDF table interval | Hourly for daily reports and periods up to two days, daily beyond that. A CSV always keeps hourly detail |
- A CSV always keeps hourly detail. It is the format to choose when you intend to do your own analysis on the numbers.
- Attributes have to be numeric. A report cannot summarise a text attribute.
- Group members are resolved when a run is generated, so a notification group is the easiest way to keep a report going to the right people. A resend is the exception: it re-delivers to the recipients the original run resolved, and never picks up somebody added to the group since.