
Widget Calculations
Widget Calculations let a widget display a computed value instead of a raw reading. There are two ways to build one, and this page covers both:
- A Quick Combination pairs two attributes with a single operation: add, subtract, multiply, or divide. Good for differences, sums, and ratios, like the gap between two temperatures.
- An Advanced Calculation opens a full formula editor. You write real math over up to 20 variables, with functions, constants, and ready-made templates. Good for unit conversions, sensor calibration, and physics formulas like dew point or three-phase power.
- Chart — the calculated value is plotted as a trend over time.
- Single Status — one calculated value from the latest readings of the inputs.
- Multi Status — the same latest-value calculation, set per Device Attribute section, so calculated and plain rows can be mixed in one table or list.
- XY-Chart — one calculation per axis, so the horizontal and the vertical value are each worked out on their own. See XY charts: one calculation per axis below.
Quick Combinations
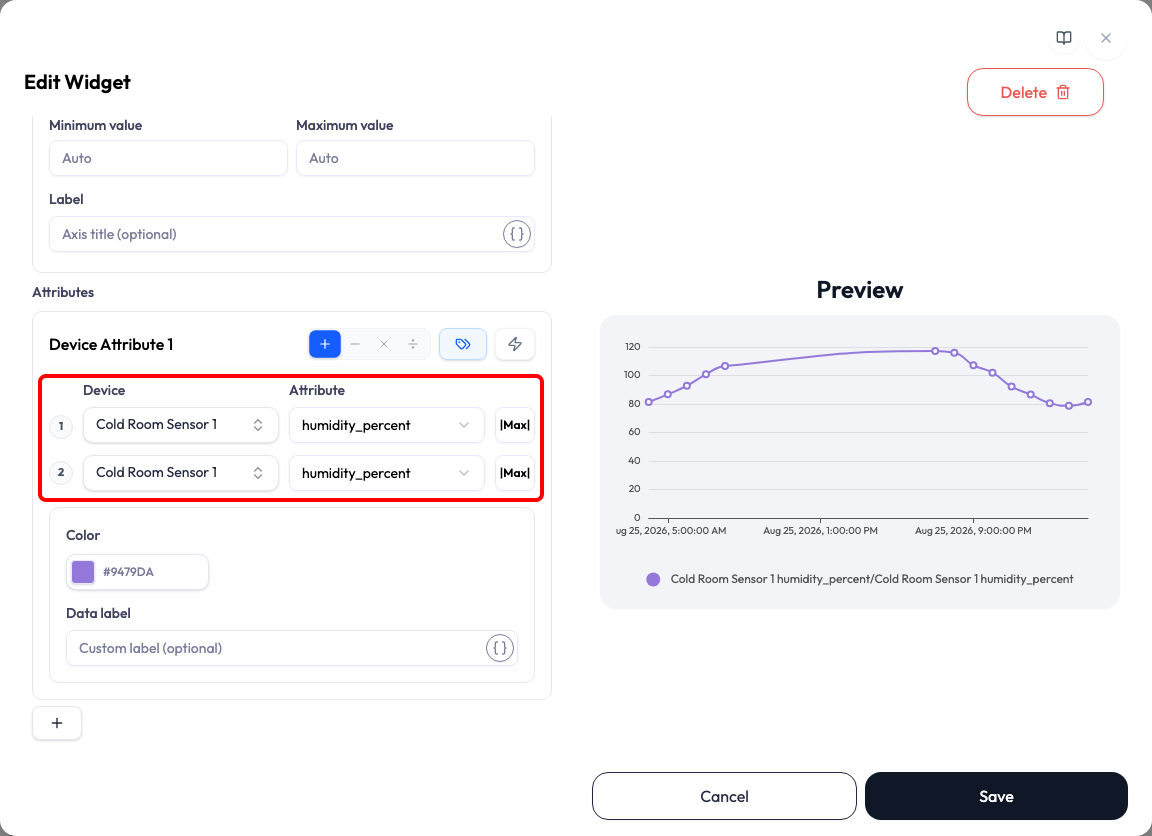
A Quick Combination lives on the attribute row itself. You switch the row into Multi Mode, pick one operation, and pick the two attributes. The widget then shows attribute ① <operation> attribute ②.
-
1Switch to Multi Mode. In the widget editor, open the Device Attribute section and click the Mode Switch button (the tag icon). Clicking it again returns to Single Mode.
-
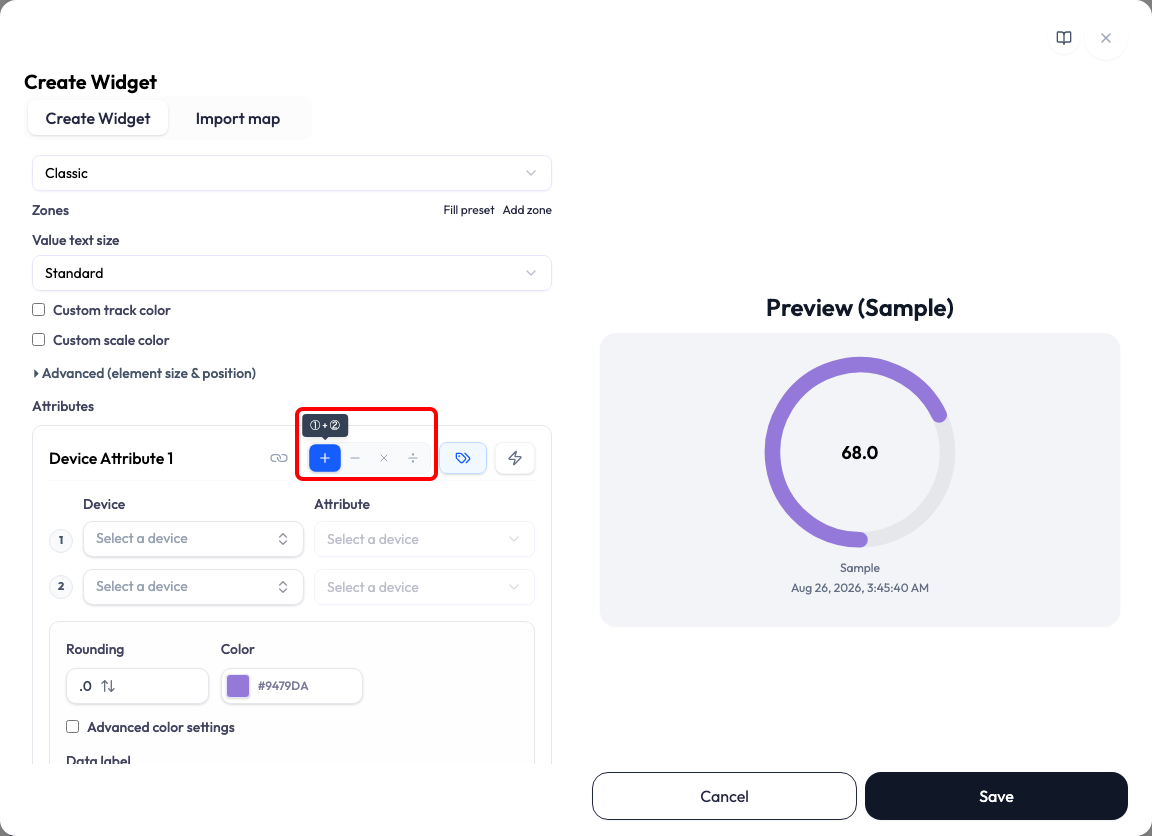
2Pick the operation. Operation buttons appear beside the Mode Switch: +, −, ×, or ÷. Hovering one shows the formula it applies, for example ① + ②.
-
3Pick the two attributes. Two numbered rows (① and ②) each take a Device and an Attribute. Once both are set, the Preview shows the calculated result.
-
4Finish as usual. Style options such as Color, Data label, and Rounding work exactly as they do for a plain attribute. Save the widget.
Strict Timestamp Mode (status widgets)
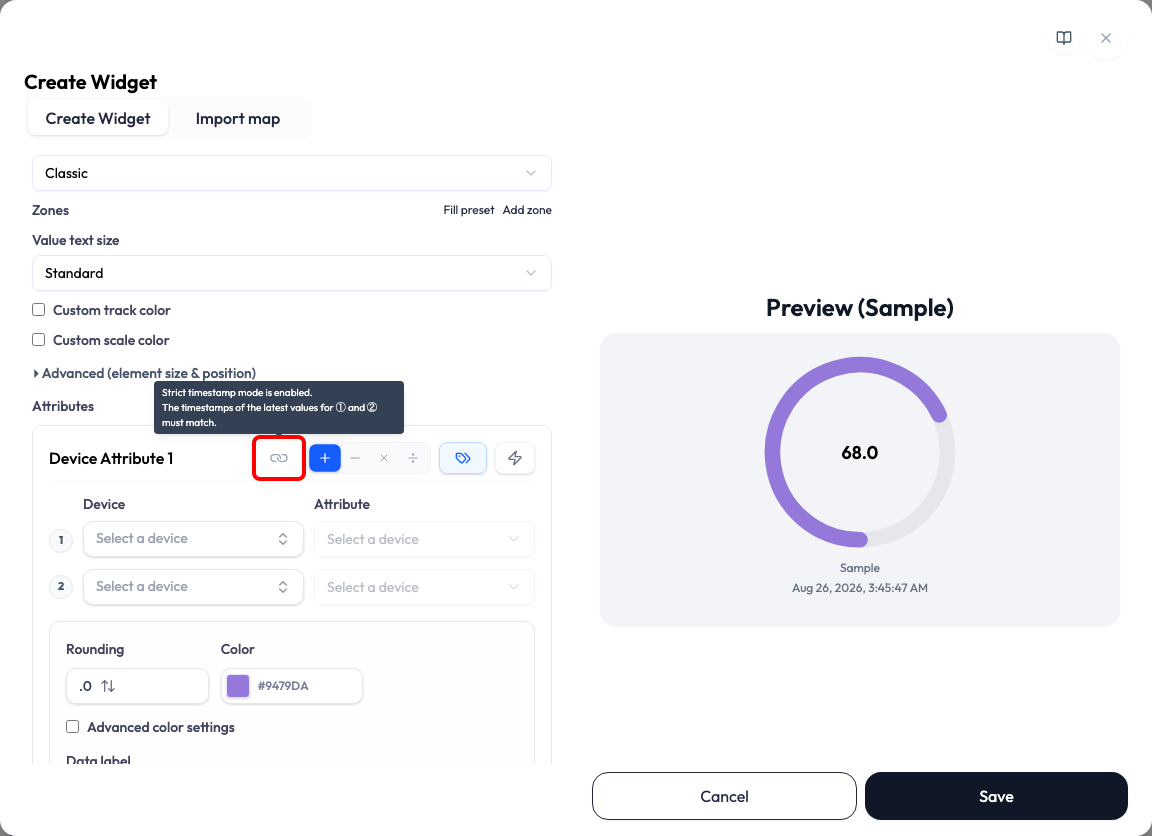
On Single Status and Multi Status widgets, a chain-link button next to the operation buttons toggles Strict Timestamp Mode. It is on by default. While it is on, the latest values of ① and ② must carry the same timestamp for a result to be computed. Turn it off and each attribute’s own latest value is used, regardless of timestamp.
Mixing calculated and plain rows (Multi Status)
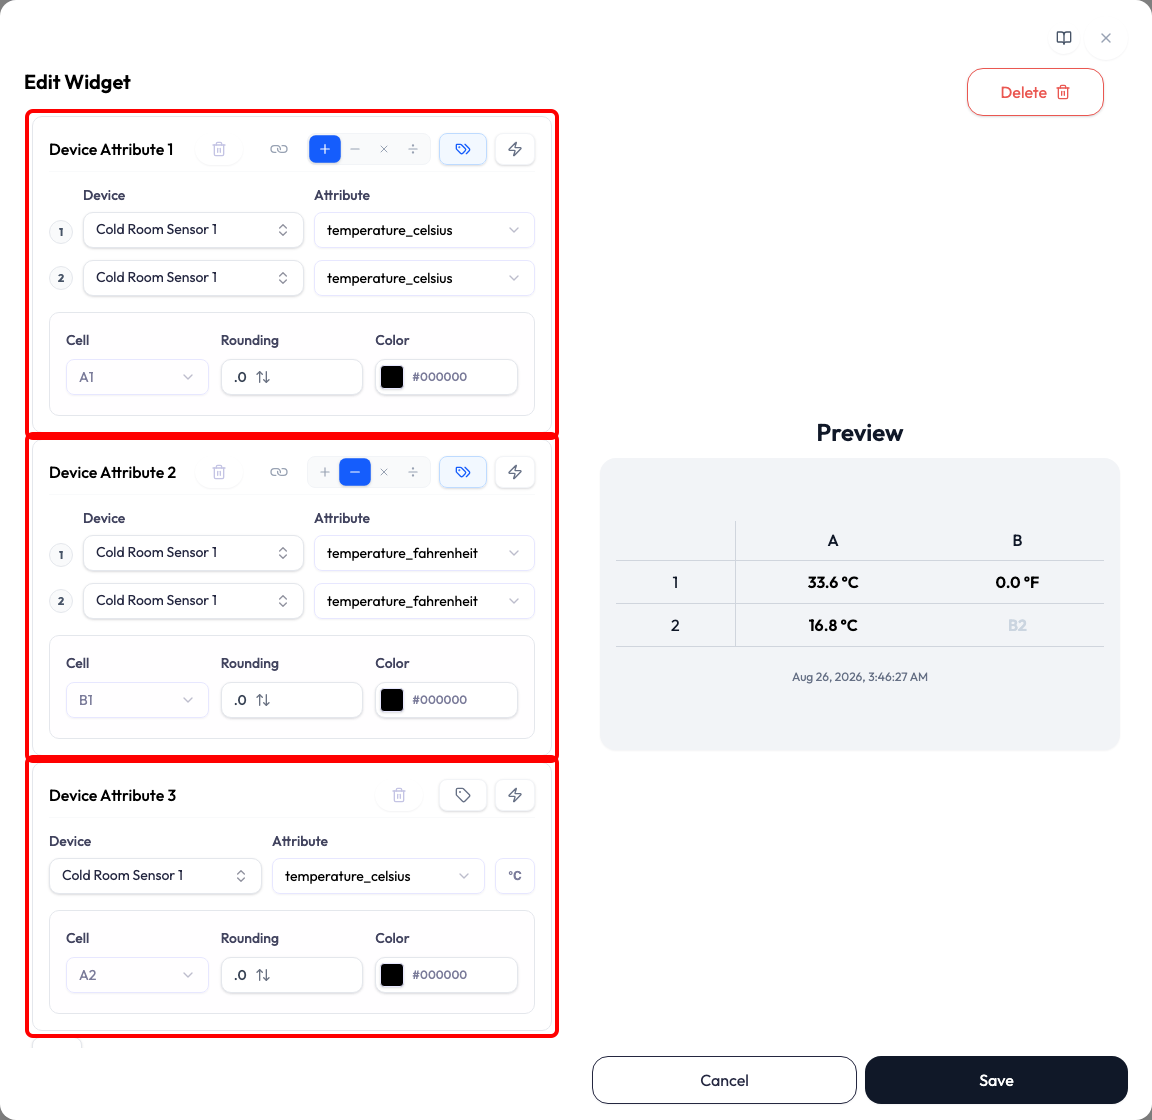
A Multi Status widget has several Device Attribute sections, and each one is independent. Put a combination in some sections and leave others as plain attributes; the table shows both kinds side by side.
Charts
On a Chart the flow is identical: Multi Mode, operation, attributes ① and ②. Each attribute also keeps its Statistic when the chart aggregates, so you control how each side is reduced before the operation is applied. The result is plotted over the shared timeline.
When the result can’t be calculated
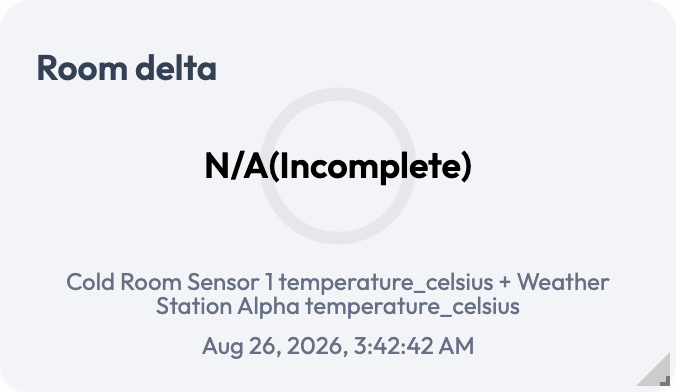
When a combination cannot be computed, the widget says so instead of showing a made-up number. On a status widget the value area reads N/A with the reason; on a chart the affected point shows N/A in the tooltip rather than being plotted.
- N/A(Incomplete) — the timestamps of ① and ② do not match under Strict Timestamp Mode, or one side has no data.
- N/A(Division by Zero) — division is selected and the divisor is zero.
- N/A(Not as a Number) — an input exists but is not numeric, so the operation cannot run.
Advanced Calculations
When one operation is not enough, the Advanced Calculation editor lets you write a full formula: several variables, functions, constants, powers, and roots, shown as real typeset math rather than code. The formula runs in your browser as data streams in, and the result renders on the widget like any other series.
Creating a calculation
-
1Open the editor. On a Device Attribute section, click the lightning-bolt (⚡) button. The Calculation editor opens over the widget editor, with one empty variable ready to bind.
-
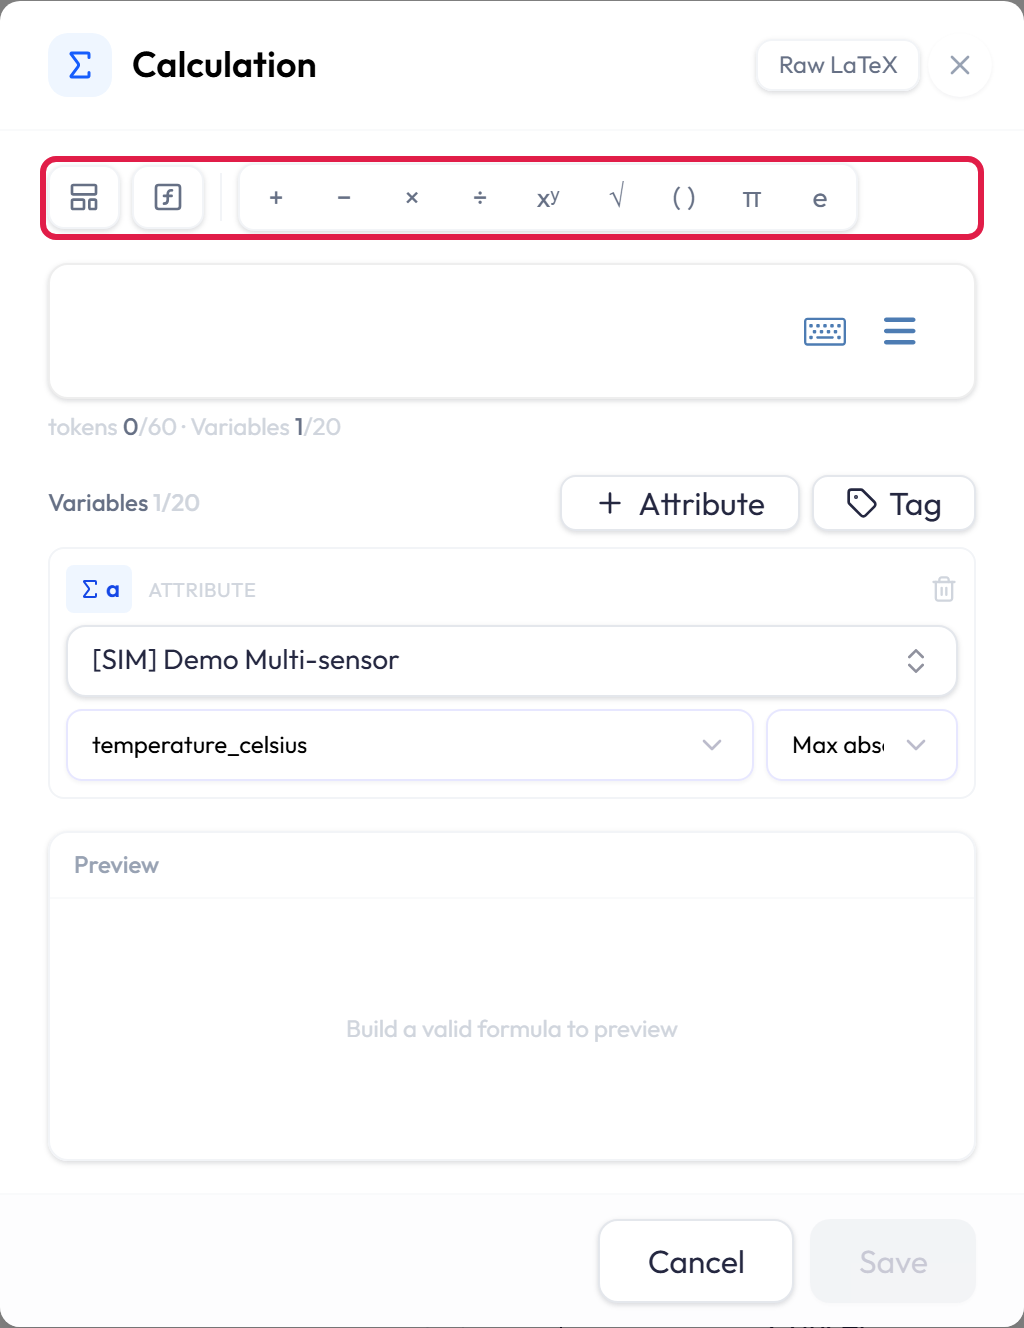
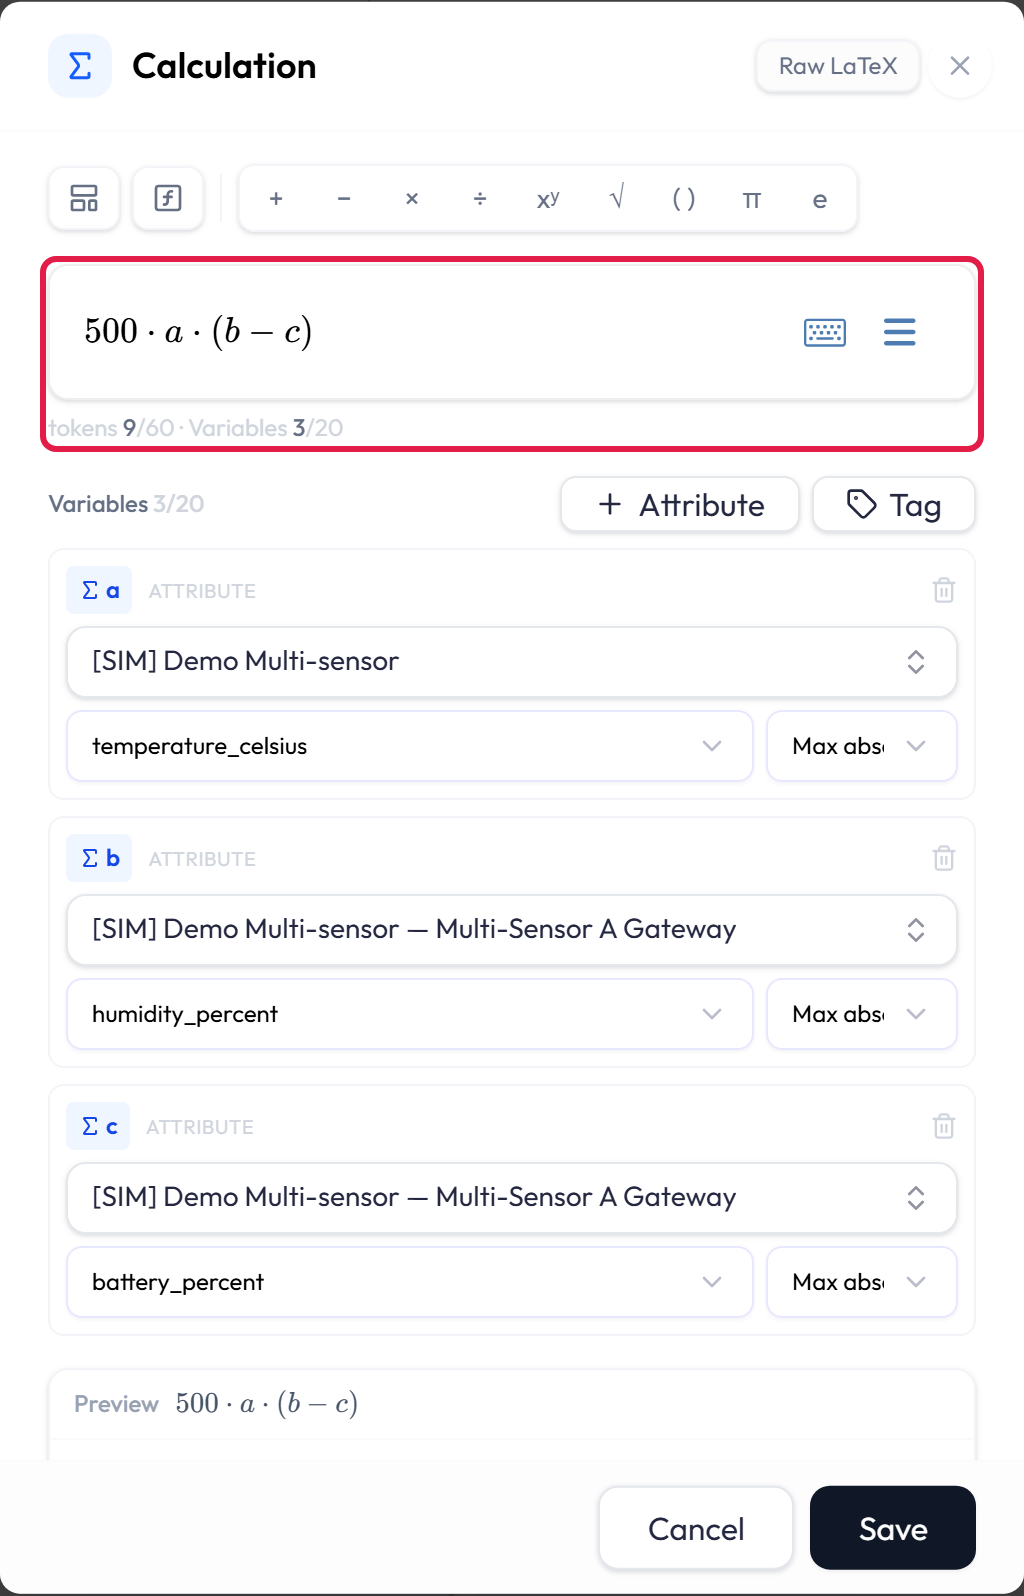
2Build the formula. Use the toolbar buttons, pick a Template, or just type. Typing is live math, not plain text:
/makes a fraction,^a power, and function names likesinconvert as you type them. -
3Bind the variables. Each variable in the formula gets a card below it. Add more with + Attribute (a device’s numeric attribute) or Tag (the value of a numeric tag). Plain numbers are typed straight into the formula and need no variable.
-
4Check the preview, then Save. A live chart computes the formula on recent data as you edit. Save stays disabled until the formula is valid, every empty box is filled, and each variable it uses is bound. On a Chart, at least one variable must be a device attribute. On status widgets a formula built only from tag variables is allowed, and evaluates against the tags’ current values.
The editor, top to bottom
| Part | What it does |
|---|---|
| Formula | A keyboard button opens an on-screen math keypad, and a menu offers undo, redo, and copy and paste. |
| Counters |
tokens n/60 · Variables n/20, updating live, so you can see how close a
formula is before anything blocks.
|
| Variables |
|
| Preview |
|
![The Calculation editor with an attribute card, a, bound to [SIM] Demo Multi-sensor and temperature_celsius, and a tag card, b, whose Tag picker is open. Under a Search tags… box the list shows Floor area, FLOAT, 120.5 highlighted, then Criticality, Owner, and Environment tags marked STRING in grey, each with the note Only numeric (INT or FLOAT) tags can be used.](https://neqto.ai/wp-content/uploads/2026/10/widget-calculations-tag-picker.png)
Templates: ready-made formulas
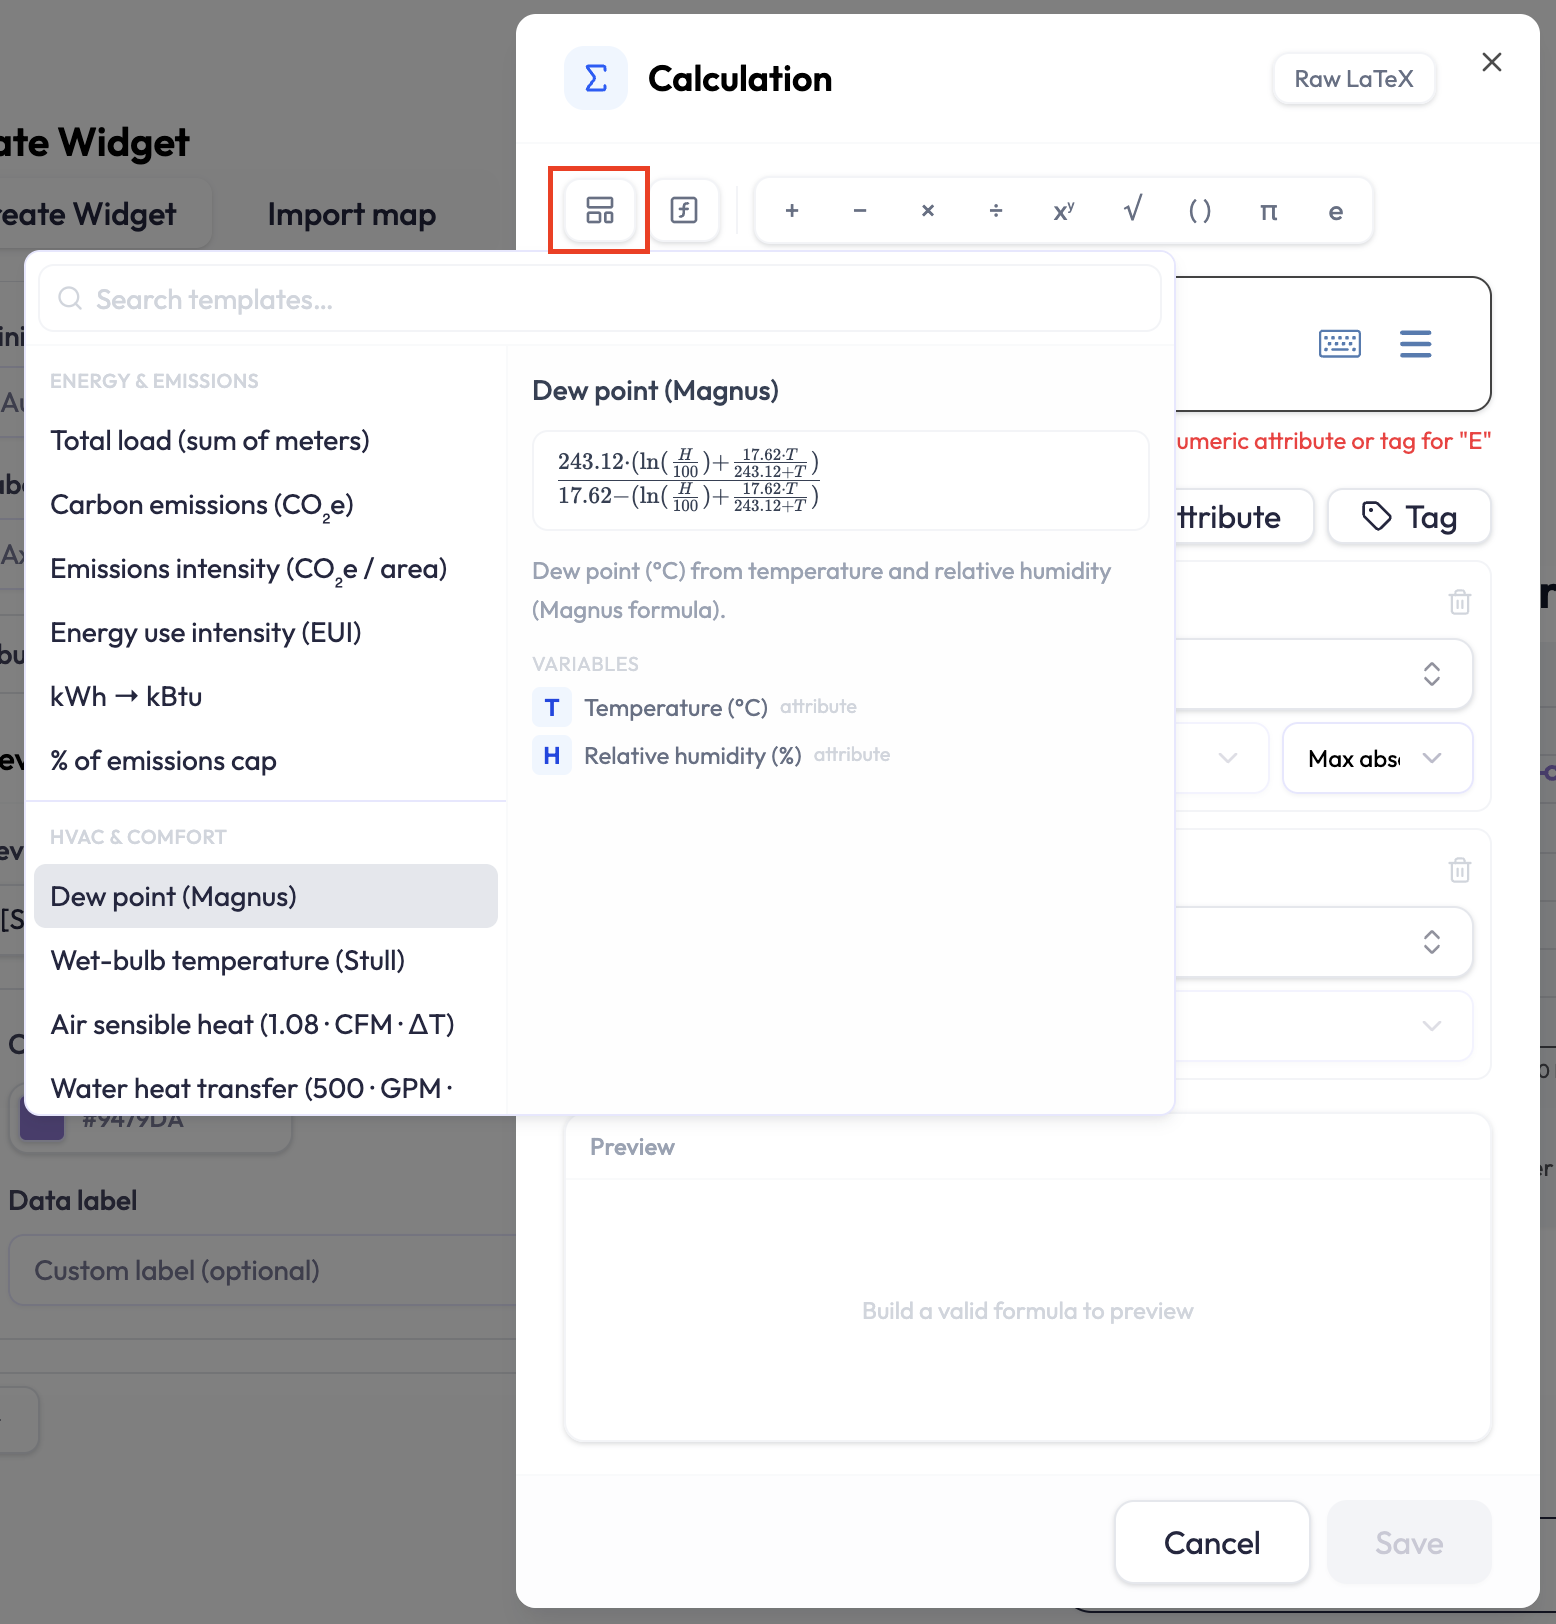
The Templates menu holds about thirty real-world formulas, searchable and grouped by category. Selecting one shows its typeset formula, a plain-language description, and the variables it needs. Picking it drops the formula into the editor with empty variable slots for you to bind. In an alert condition, a template’s tag slots arrive as empty boxes instead, for you to type the number in or to bind with Tag afterwards. On an axis they always arrive as empty boxes; see the XY section below.
| Category | Examples |
|---|---|
| Energy & emissions | Total load, carbon emissions (CO₂e), emissions intensity, energy use intensity (EUI), kWh → kBtu, % of emissions cap. |
| HVAC & comfort | Dew point, wet-bulb temperature, air and water heat transfer, chiller efficiency (kW/ton), wind chill, vapor-pressure deficit, flow from differential pressure. |
| Power | Three-phase power, apparent power, power factor, reactive power, load factor. |
| Sensors & signal | Linear scaling and 4–20 mA span mapping for analog signals, NTC thermistor temperature, RSSI → distance, decibel ratios, tank volume from liquid level (vertical or horizontal cylinders, gallons or liters). |
| Ratios | Efficiency (%), % of setpoint. |
Every template computes point by point on the aligned timeline. None of them need history or a rolling window.
Functions, and how they work
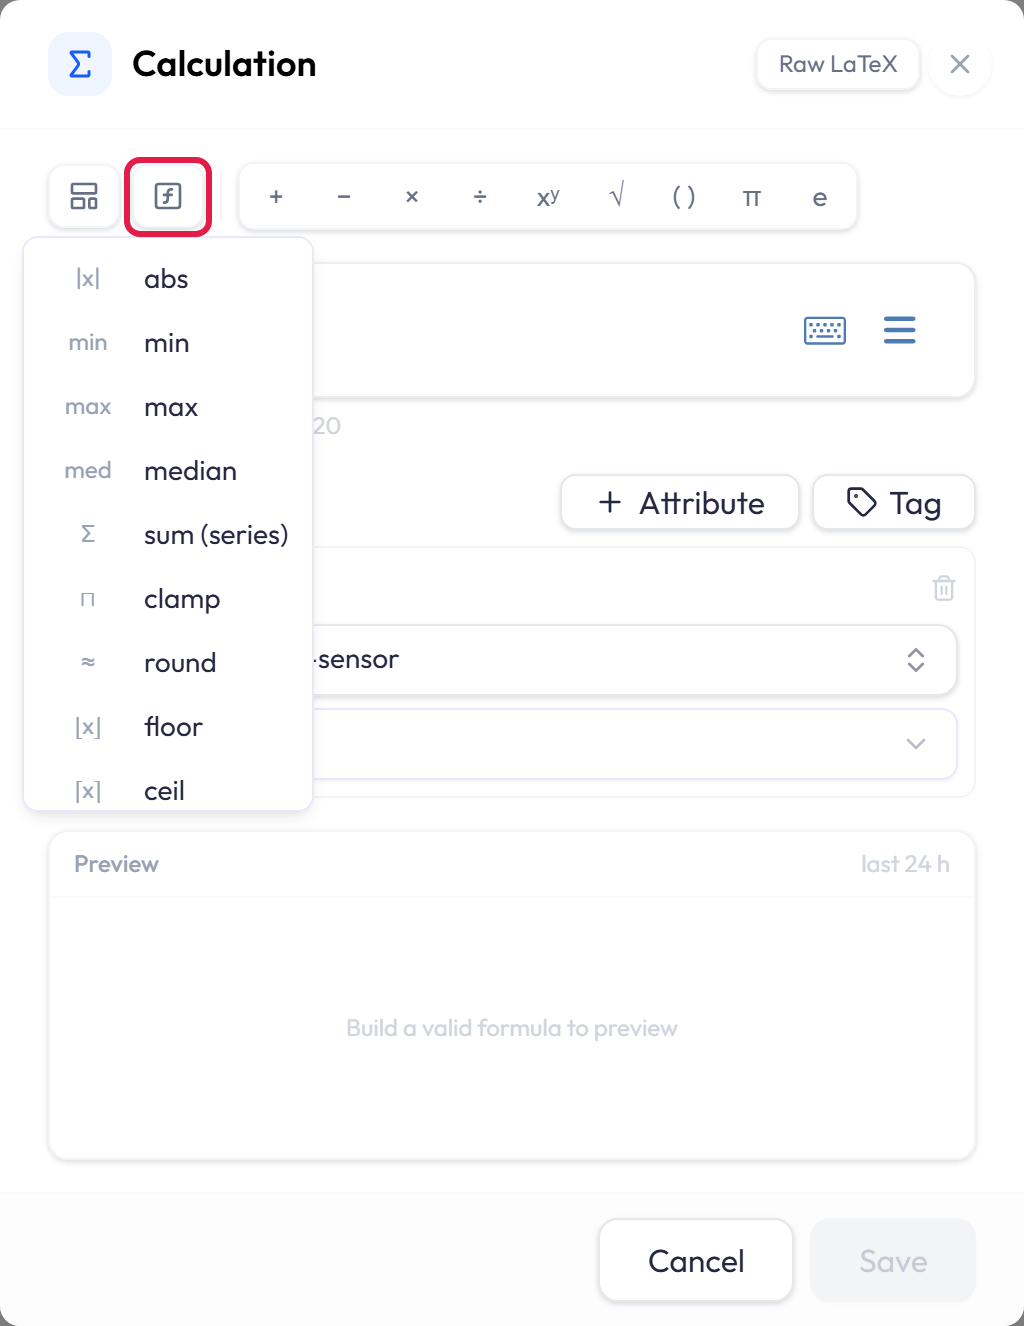
Every function takes numbers and returns a number. The Functions menu inserts
the common ones in one click: the rounding and bounding functions, the series sum, ln,
log10, exp, hypot, cbrt, and the basic
trigonometry. The rest are typed by name or written in LaTeX.
| Group | Functions |
|---|---|
| Rounding & sign |
abs, ceil, floor, round,
trunc (drop the decimals), sign (−1, 0, or 1)
|
| Roots & exponential | sqrt, cbrt, exp |
| Logarithms |
ln, log10, log2, logb(x, base)
|
| Trigonometry |
sin, cos, tan; inverses asin,
acos, atan, atan2(y, x)
|
| Angle conversion |
radians (degrees → radians), degrees (radians → degrees)
|
| Hyperbolic |
sinh, cosh, tanh and their inverses
|
| Over several inputs |
min, max, sum, mean,
median, hypot
|
| Series | Σ — a sum over an index (see below) |
| Bounding | clamp(x, low, high) — pins x inside a range |
| Remainder | remainder (modulo), inserted from the Functions menu |
A few conventions keep formulas unambiguous:
-
Trigonometry works in radians. Write a value with the
°sign and it is converted from degrees automatically (× π⁄180). -
A bare
logmeanslog10. Writeln,log10, or an explicit base to be precise. -
There is no separate
pow. Use the power operator (x^y). - Division by zero never produces a number. It shows as a gap on the widget (see “On the dashboard” below).
-
The index is required — write
n=1under the sign. A Σ without one is rejected. - The bounds must be whole-number constants or numeric tag variables, and a tag used as a bound must hold a whole number. An attribute cannot be a bound, and in an alert condition neither can a tag.
- The editor expands the sum into plain additions as you type, so the token counter includes the expanded cost (a note reads “Σ expanded to N terms”). A sum past 25 terms is rejected.
Raw LaTeX mode
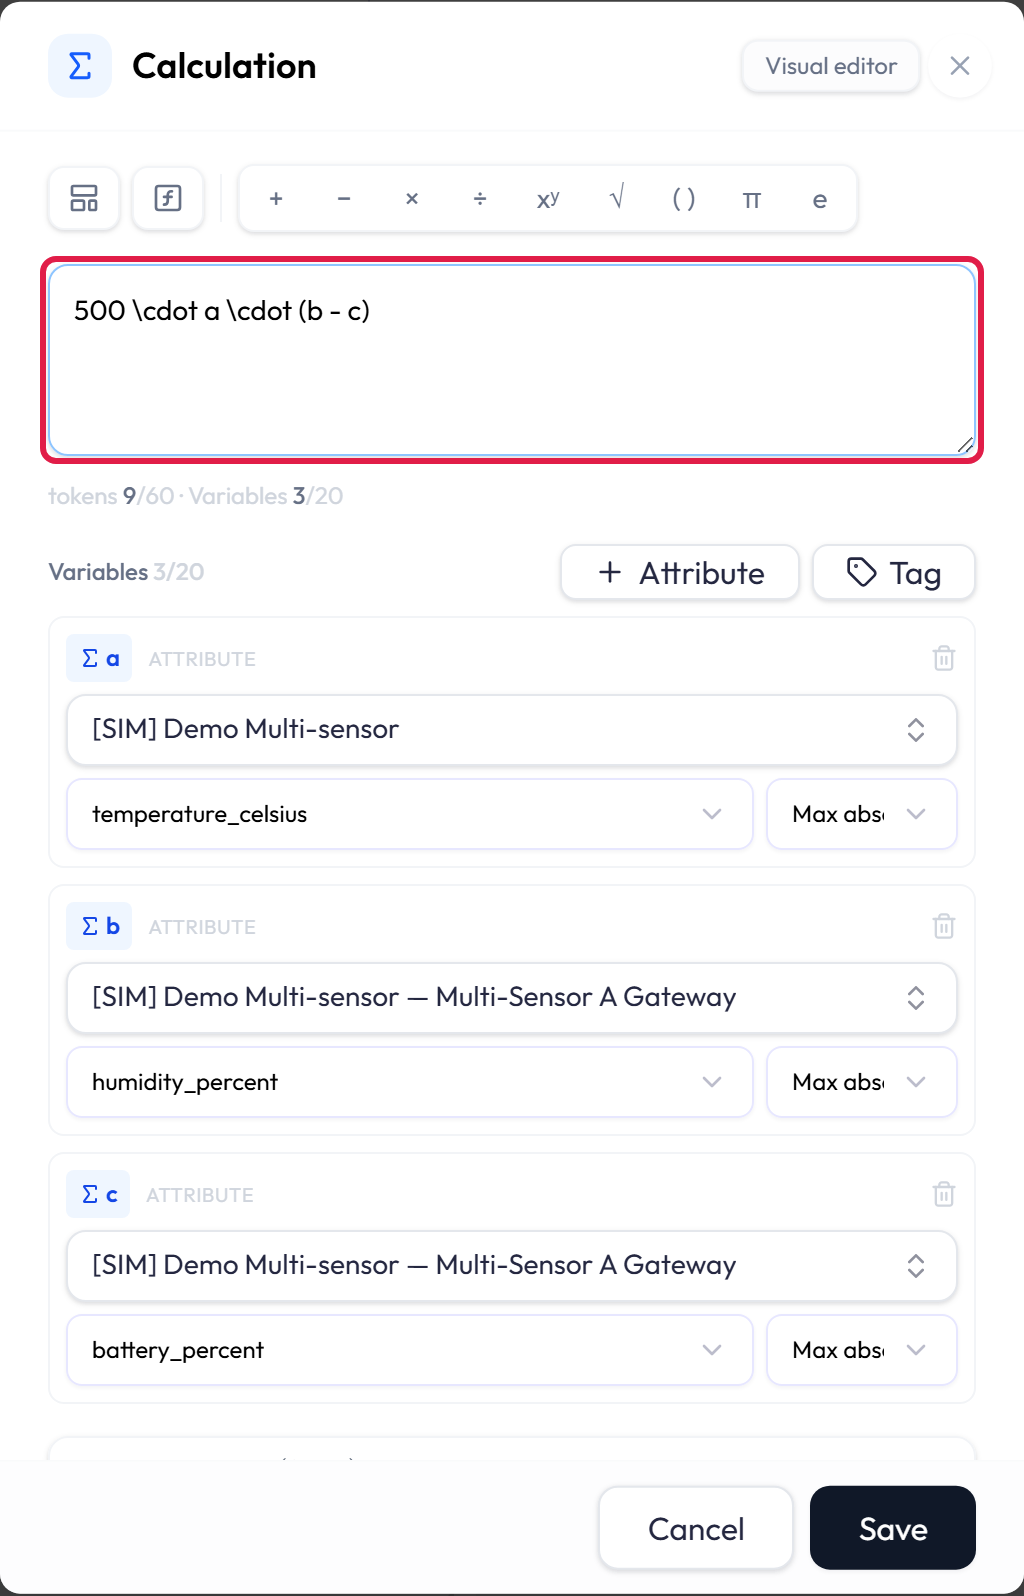
The Raw LaTeX button swaps the typeset formula for its plain LaTeX text, and
back again with Visual editor. Anything you can build visually has a written
form, for example \frac{a}{b}, \sqrt{x}, or
\operatorname{clamp}(x, 0, 100). In the visual editor you can also press
\ and type a command directly. One deliberate exception: \bmod is
rejected — use the remainder function instead, because their behavior differs on negative
numbers.
After saving: edit and remove
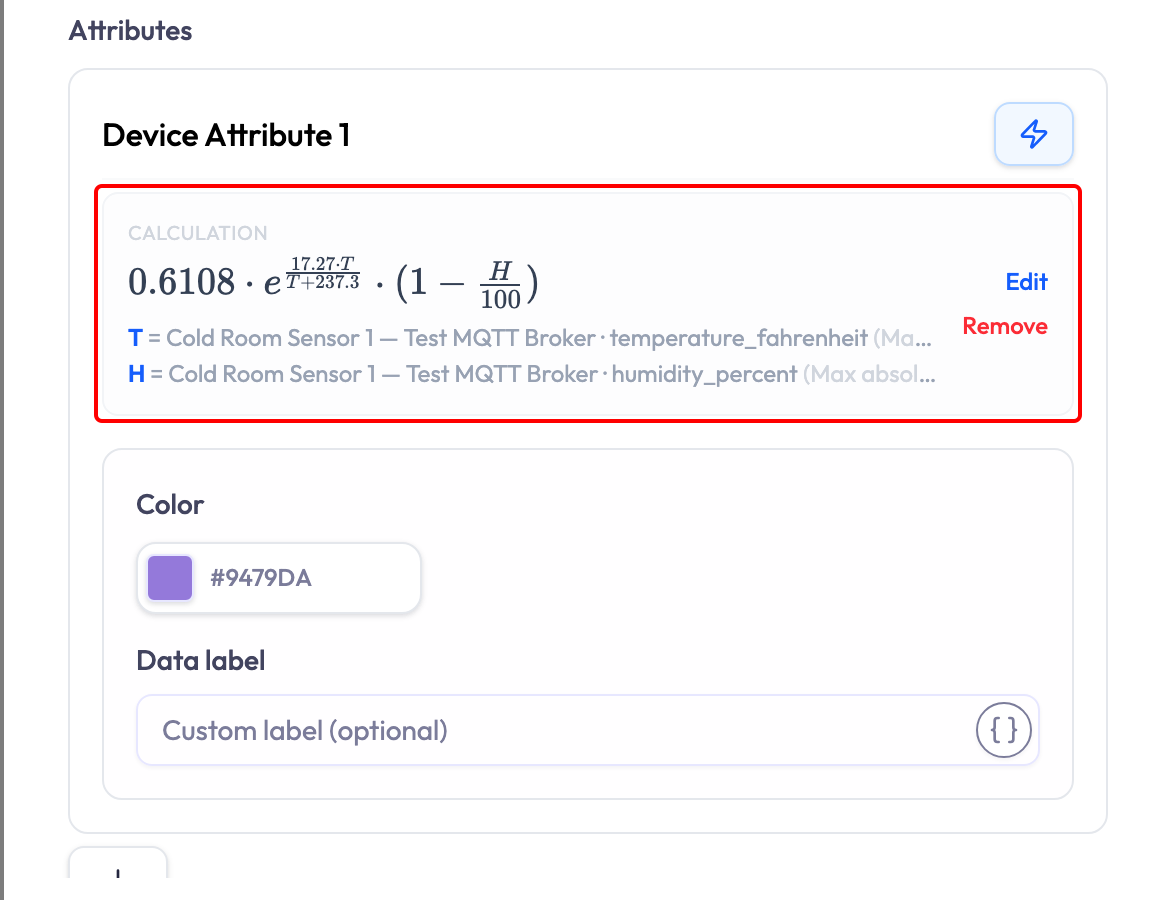
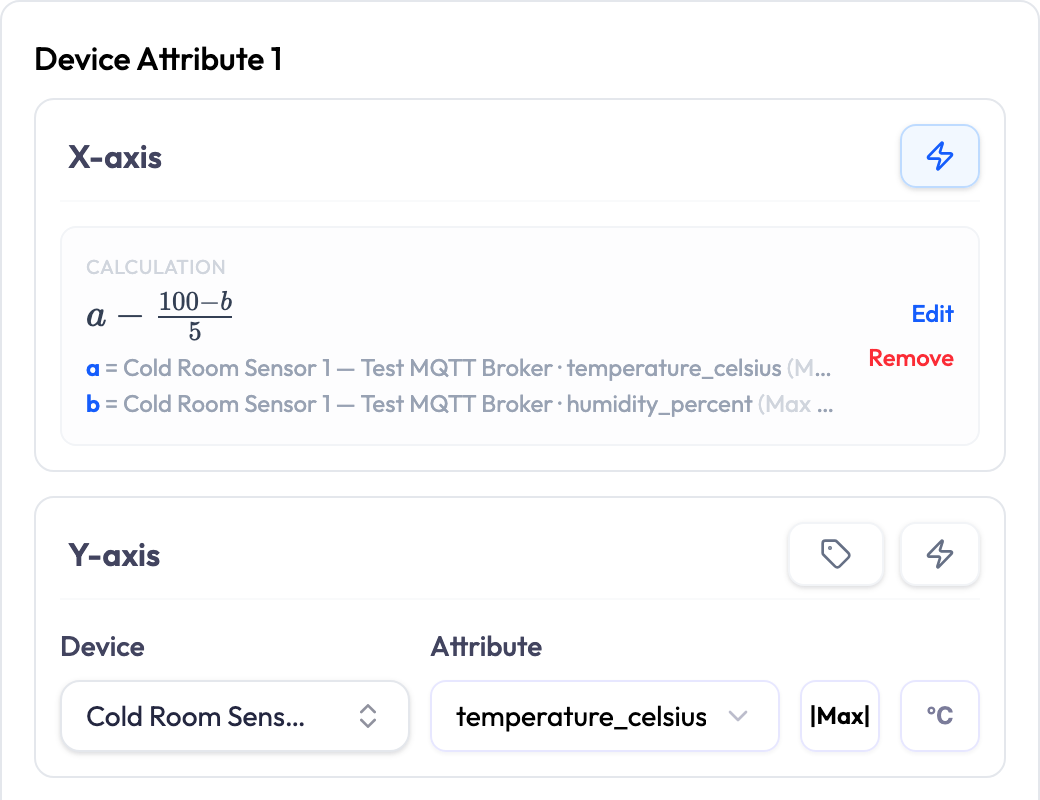
Saving the editor turns the Device Attribute section into a calculated series. The section now shows a CALCULATION box: the typeset formula, a legend of the variables and what each is bound to, and two links.
- Edit (or the ⚡ button, now highlighted) reopens the editor with the saved formula and variables.
- Remove deletes the formula and its variables and returns the section to a plain attribute. It asks first — “The formula and its variables will be removed from this data point. The first device attribute is kept.” — so the row is not left empty.
The calculation is stored with the widget, so remember to save the widget itself after closing the editor.
XY charts: one calculation per axis
An XY-Chart plots one measurement against another, so you attach a formula to an axis rather than to a series. Each axis holds its own formula, and removing one leaves the other axis untouched.
Most chart widgets plot a measurement against time — the horizontal axis is a clock. An XY-Chart plots one measurement against another: temperature against pressure, flow against power. Neither axis is time, so each needs a value of its own, and each gets its own formula. The horizontal axis can show a computed quantity while the vertical shows a reading exactly as the device sent it.
An XY-Chart is built from pairs, each pair one plotted series holding an
X-axis block and a Y-axis block. The ⚡ button
sits on every axis and opens the editor for that axis alone. There is no chain-link
button, because an XY-Chart only plots a point where its two measurements share a timestamp, so
there is nothing to switch off. The Mode Switch and the + − × ÷ buttons work as
they do on the other widget types.
Opening the editor from an axis
The first variable is already bound to the axis measurement, but the formula starts empty. You still write it, and Save stays disabled until you do. Add another attribute only if the formula needs one.
Open it from an axis with no measurement chosen yet and that first variable is simply empty. The preview then waits, reading Build a valid formula to preview until you have picked a device and an attribute for every variable the formula uses.
An axis takes device attributes only. The editor offers no Tag button there, and a template’s tag slots arrive as empty boxes for a number. The same holds for a Tracking Map’s Latitude and Longitude axes. An axis formula that already holds a tag reads Tag values can’t be used in this calculation. Use device attributes instead. until you replace the tag.
![The Calculation editor opened from an XY chart's X-axis. The toolbar shows the Templates and Functions menus and the operator buttons; the formula reads a minus, then 100 minus b over 5, as typeset maths; the counters read tokens 9 of 60 and Variables 2 of 20. Beside the Variables heading there is an Attribute button and no Tag button. Two variable cards labelled a and b are each bound to [SIM] Demo Multi-sensor with the attributes temperature_celsius and humidity_percent and a statistic. At the bottom a Preview panel repeats the formula and draws a blue line rising and falling over time, with Cancel and Save beneath.](https://neqto.ai/wp-content/uploads/2026/10/widget-calculations-xy-axis-preview_crop.png)
A saved axis
A saved axis shows the same CALCULATION box described above. A formula is stored per axis, and the two axes never affect each other, so saving or removing a formula on one leaves the other exactly as it was. While a formula is in place that axis loses its Mode Switch, because the formula has replaced the two-measurement picker it controls.
Limits, and how they are counted
The editor enforces five caps: variables, tokens, nesting depth, formula text length, and Σ expansion. All but the Σ cap shrink when you open the editor from an alert condition.
The editor enforces a small set of limits as you build, and the server checks the same limits again on save. Because both sides count the same way, the editor never lets you build a formula the server would reject.
The same editor can also be opened from an alert condition, where it enforces much smaller limits. An alert formula runs on every incoming reading rather than once when a chart is drawn. Both sets are given here so the numbers are in one place; see Alerts for what else changes in an alert.
| Limit | In a widget | In an alert condition |
|---|---|---|
| Variables per calculation | 20 — typed-in constants don’t count, tag variables do | 5 |
| Building blocks (tokens) per formula | 60 — a Σ counts its expanded terms | 35 |
| Nesting depth | 12 | 8 |
| Formula text length | 32,768 characters | 4,096 characters |
| Σ expansion | 25 terms | 25 terms — but the smaller token limit is reached first |
The counters above the variable list always show the limits of the place you opened the editor
from. A widget calculation counts against tokens n/60 · Variables n/20, an alert
condition against tokens n/35 · Variables n/5.
In the alert editor the computed value is called the formula result: the Compare to field carries a formula result badge, with the unit when the calculation has one, so the threshold you type is read in that unit rather than in the raw attribute’s.
-
Tokens are the building blocks of the saved formula: each variable, number,
operator, and function counts as one. The live
tokens n/60counter shows the total as you type. - Nesting depth is how deeply operations sit inside each other. A variable or a number is one level, and every operator or function sits one level above its deepest input: a + b is 2 levels, (a + b) × c is 3. Long chains of the same operation are flattened before counting, so adding many terms together does not add depth — only genuinely nested structure does.
On the dashboard
Your browser does the arithmetic as readings arrive, 12 calculations at a time per screen. Alert conditions take the same formulas, but Analytics works only from the measurements a device reported.
A saved calculation computes in the browser as readings stream in, in a background thread so the page stays responsive. Two behaviors are worth knowing:
- At most 12 calculations run at once per screen. Beyond that, extra calculated series pause and show a ⚠ badge whose tooltip reads “Calculation paused — too many on screen”, rather than silently dropping or slowing the page.
- A gap is shown rather than a number. A division by zero, an impossible result, or missing input data becomes a visible gap with a small ⚠ marker, never a made-up zero. On a single-status widget, an invalid latest value shows blank.
Describing a calculation to the assistant
You do not have to write the formula yourself. Ask in Ask AI for the widget you want in plain language, for example a chart of the difference between the supply and return temperatures, and the assistant proposes a widget whose series carries the formula. The proposal shows the formula as typeset math with a Copy formula button, and Add to Dashboard opens the widget editor with the calculation already in place, so you can check the bound variables in the CALCULATION box before saving. The same applies when the assistant drafts an alert with a calculated condition. Treat the proposed formula as a draft: check the operands and units against the readings before you rely on it. The Calculation editor itself has no describe-in-words field; the plain-language route is the chat.